What’s inside the Outpost.
Everything an aurora chaser needs in one app — space weather, cloud forecasts, sighting reports, AR field tools, alerts, and a learning library. Built around how chasers actually decide whether to head out, where to go, and when.
Aurora Outpost is in continuous active development — screenshots and copy on this page may lag the current build slightly between updates.

FORECASTING & MONITORING
The DATA tab has four sub-pages — SOLAR WIND, SOLAR ACTIVITY, GEOMAGNETIC, and CUSTOM. Live feeds from NOAA SWPC, NASA SDO/LASCO/STEREO, ESA Solar Orbiter, USGS, IRF Sweden, GeoNet, DTU Space, and SILSO. One scroll, no tab juggling.
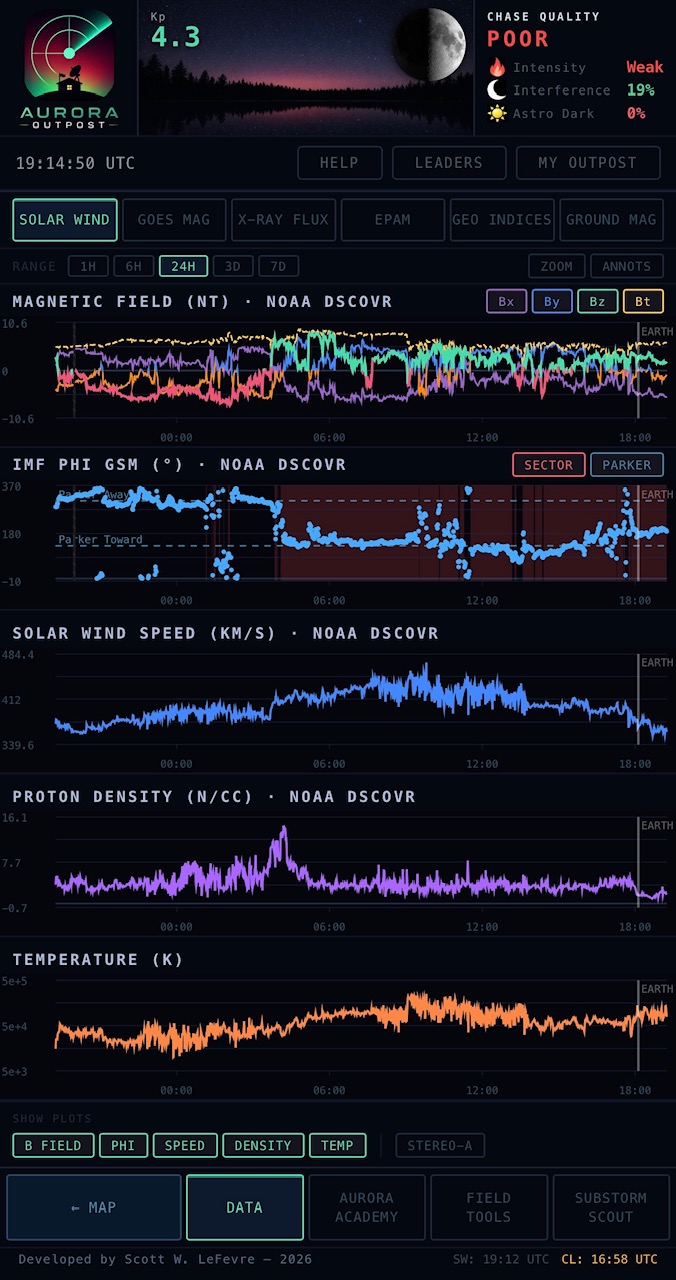
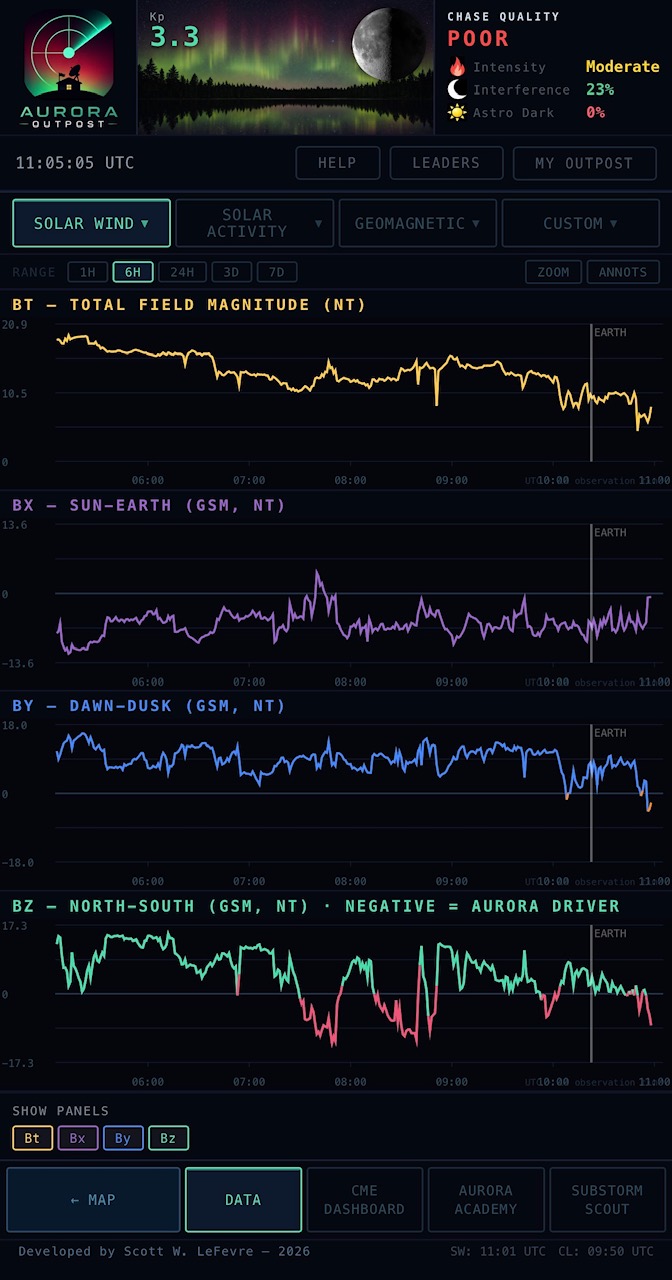
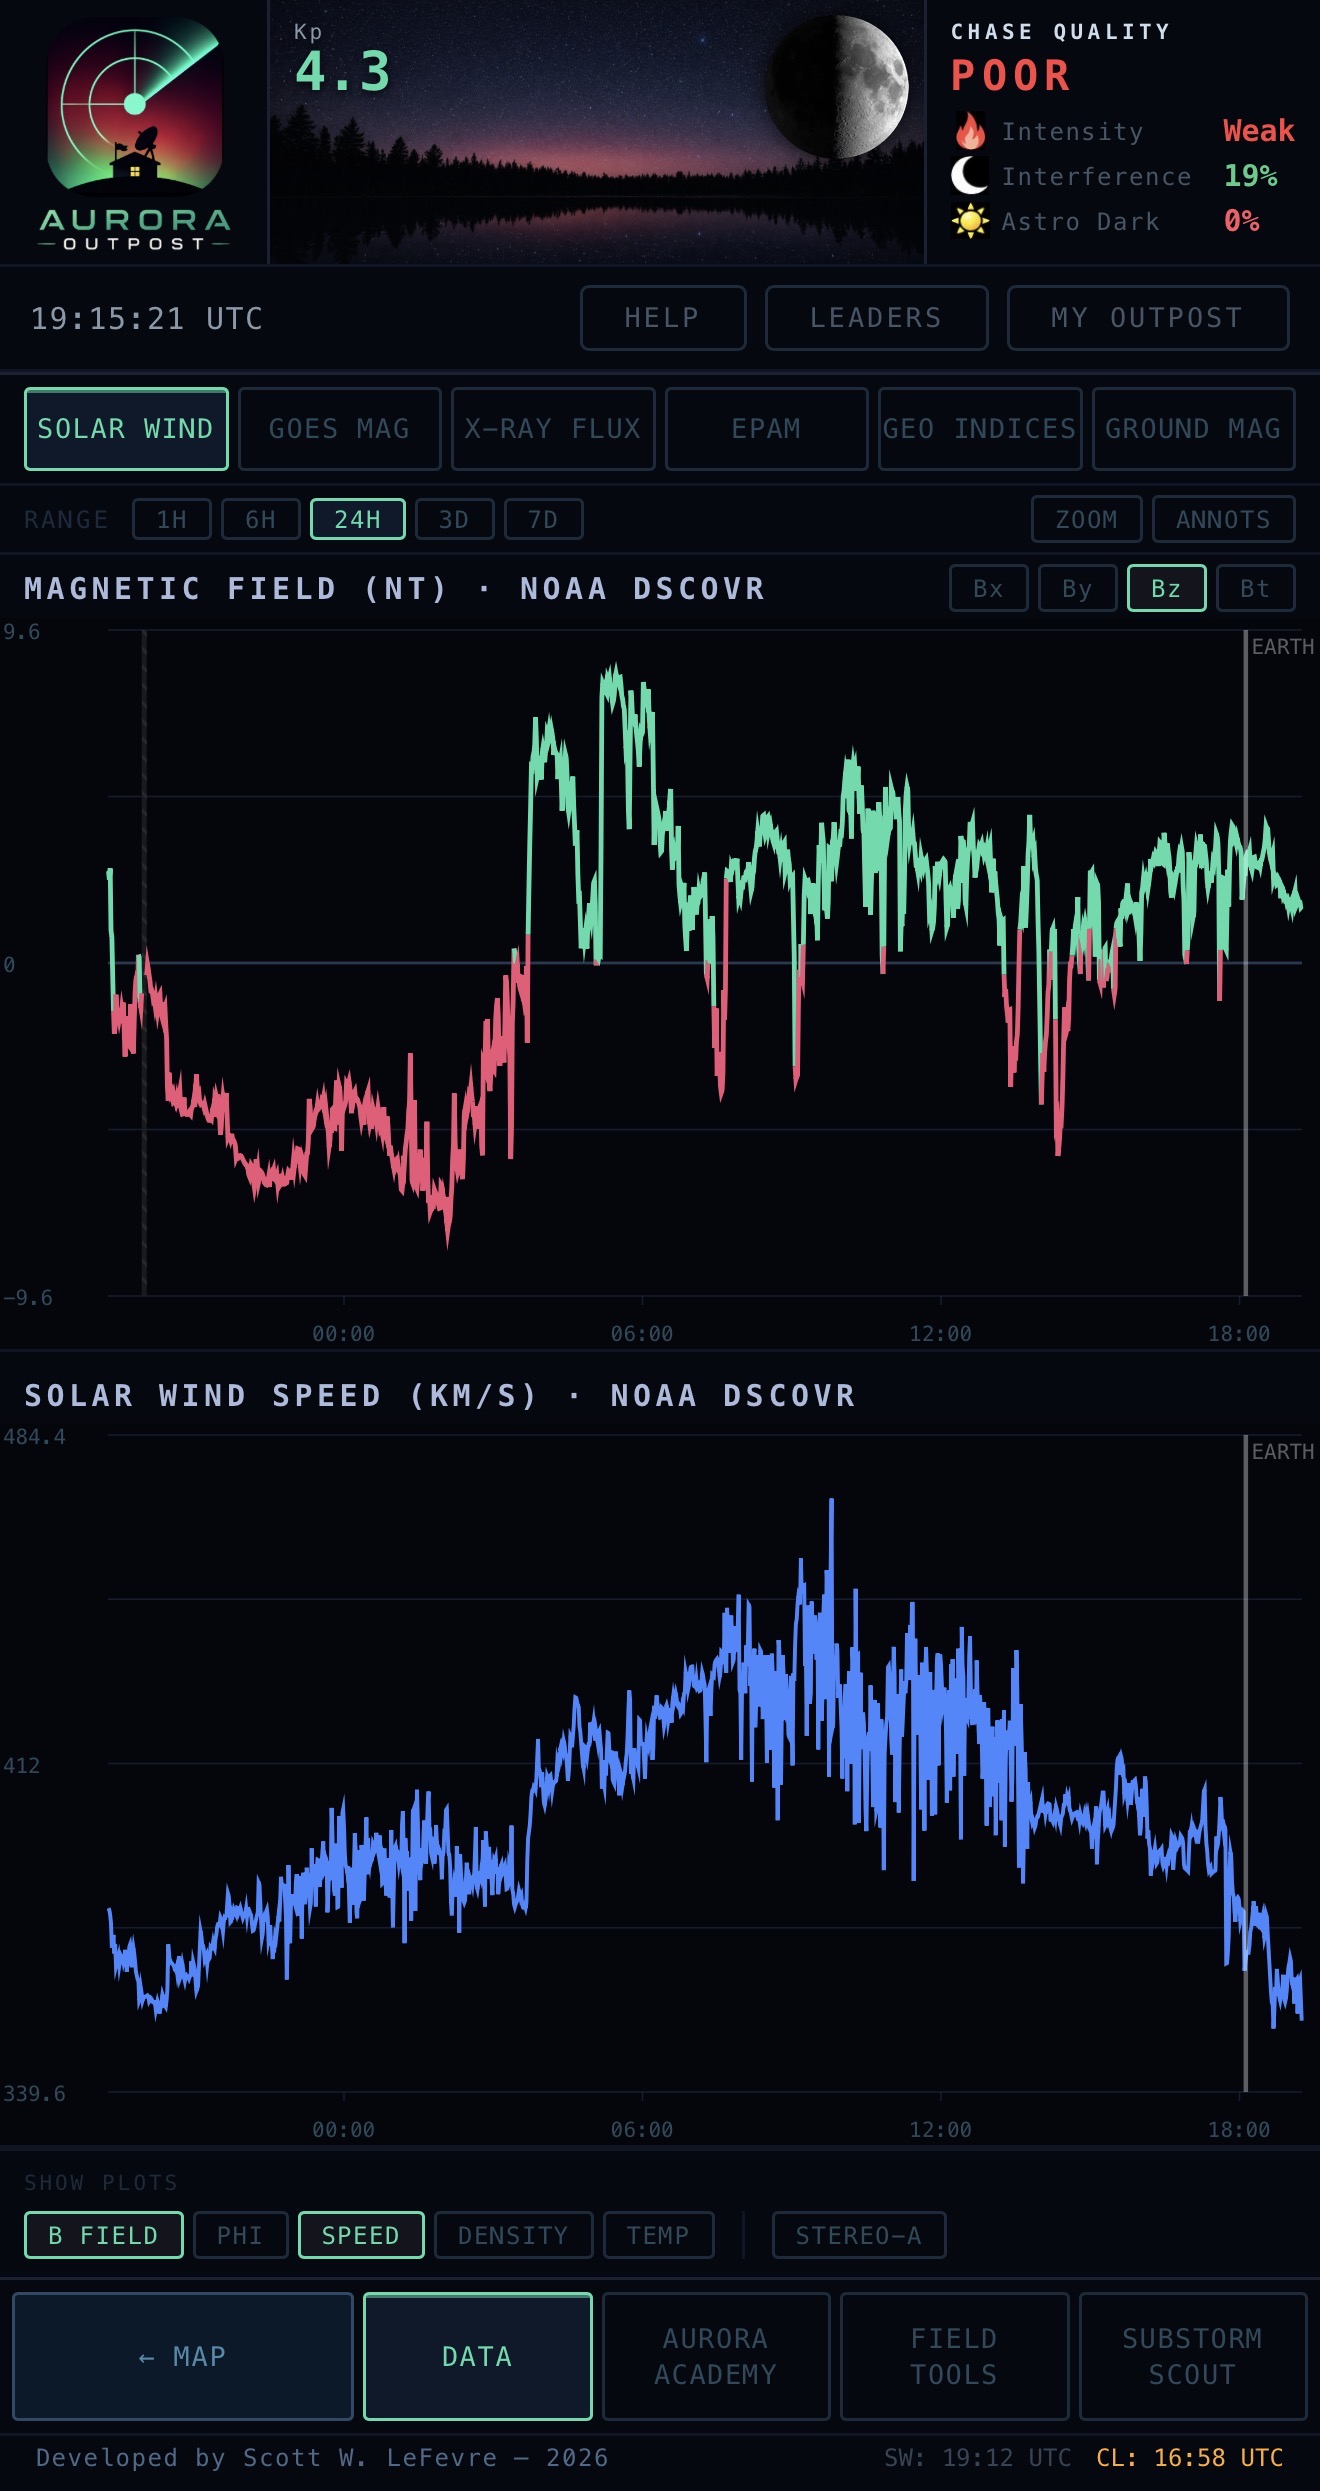
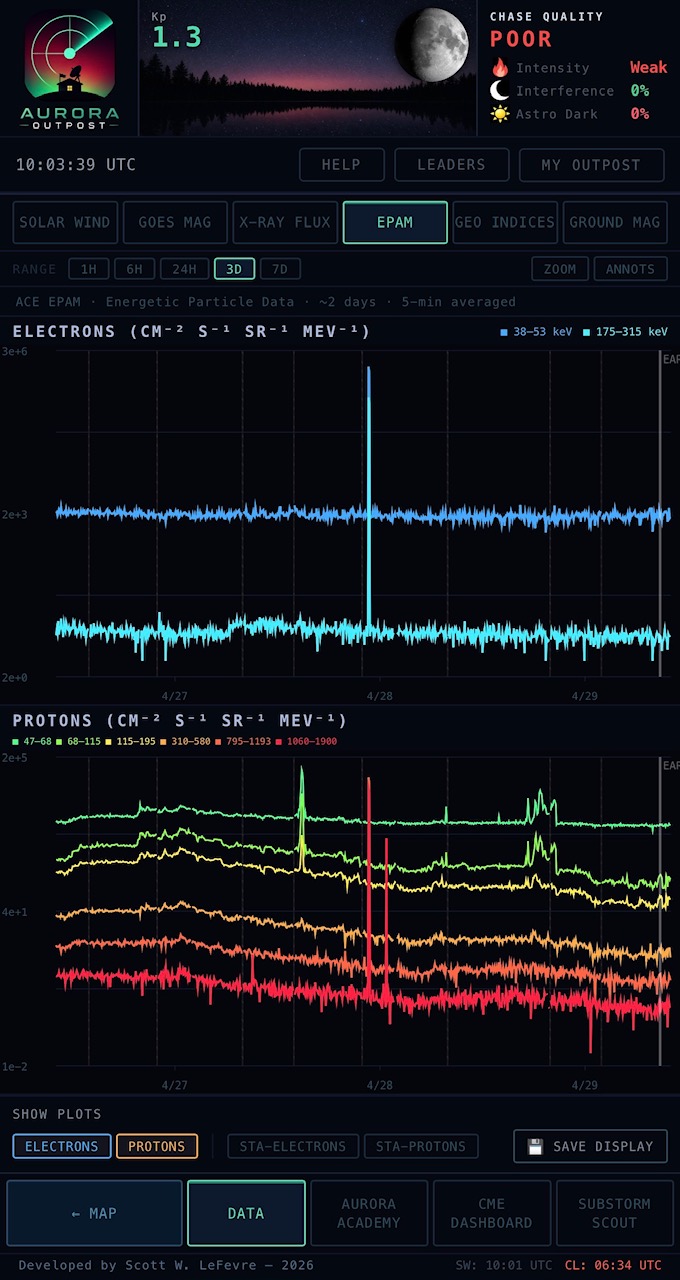
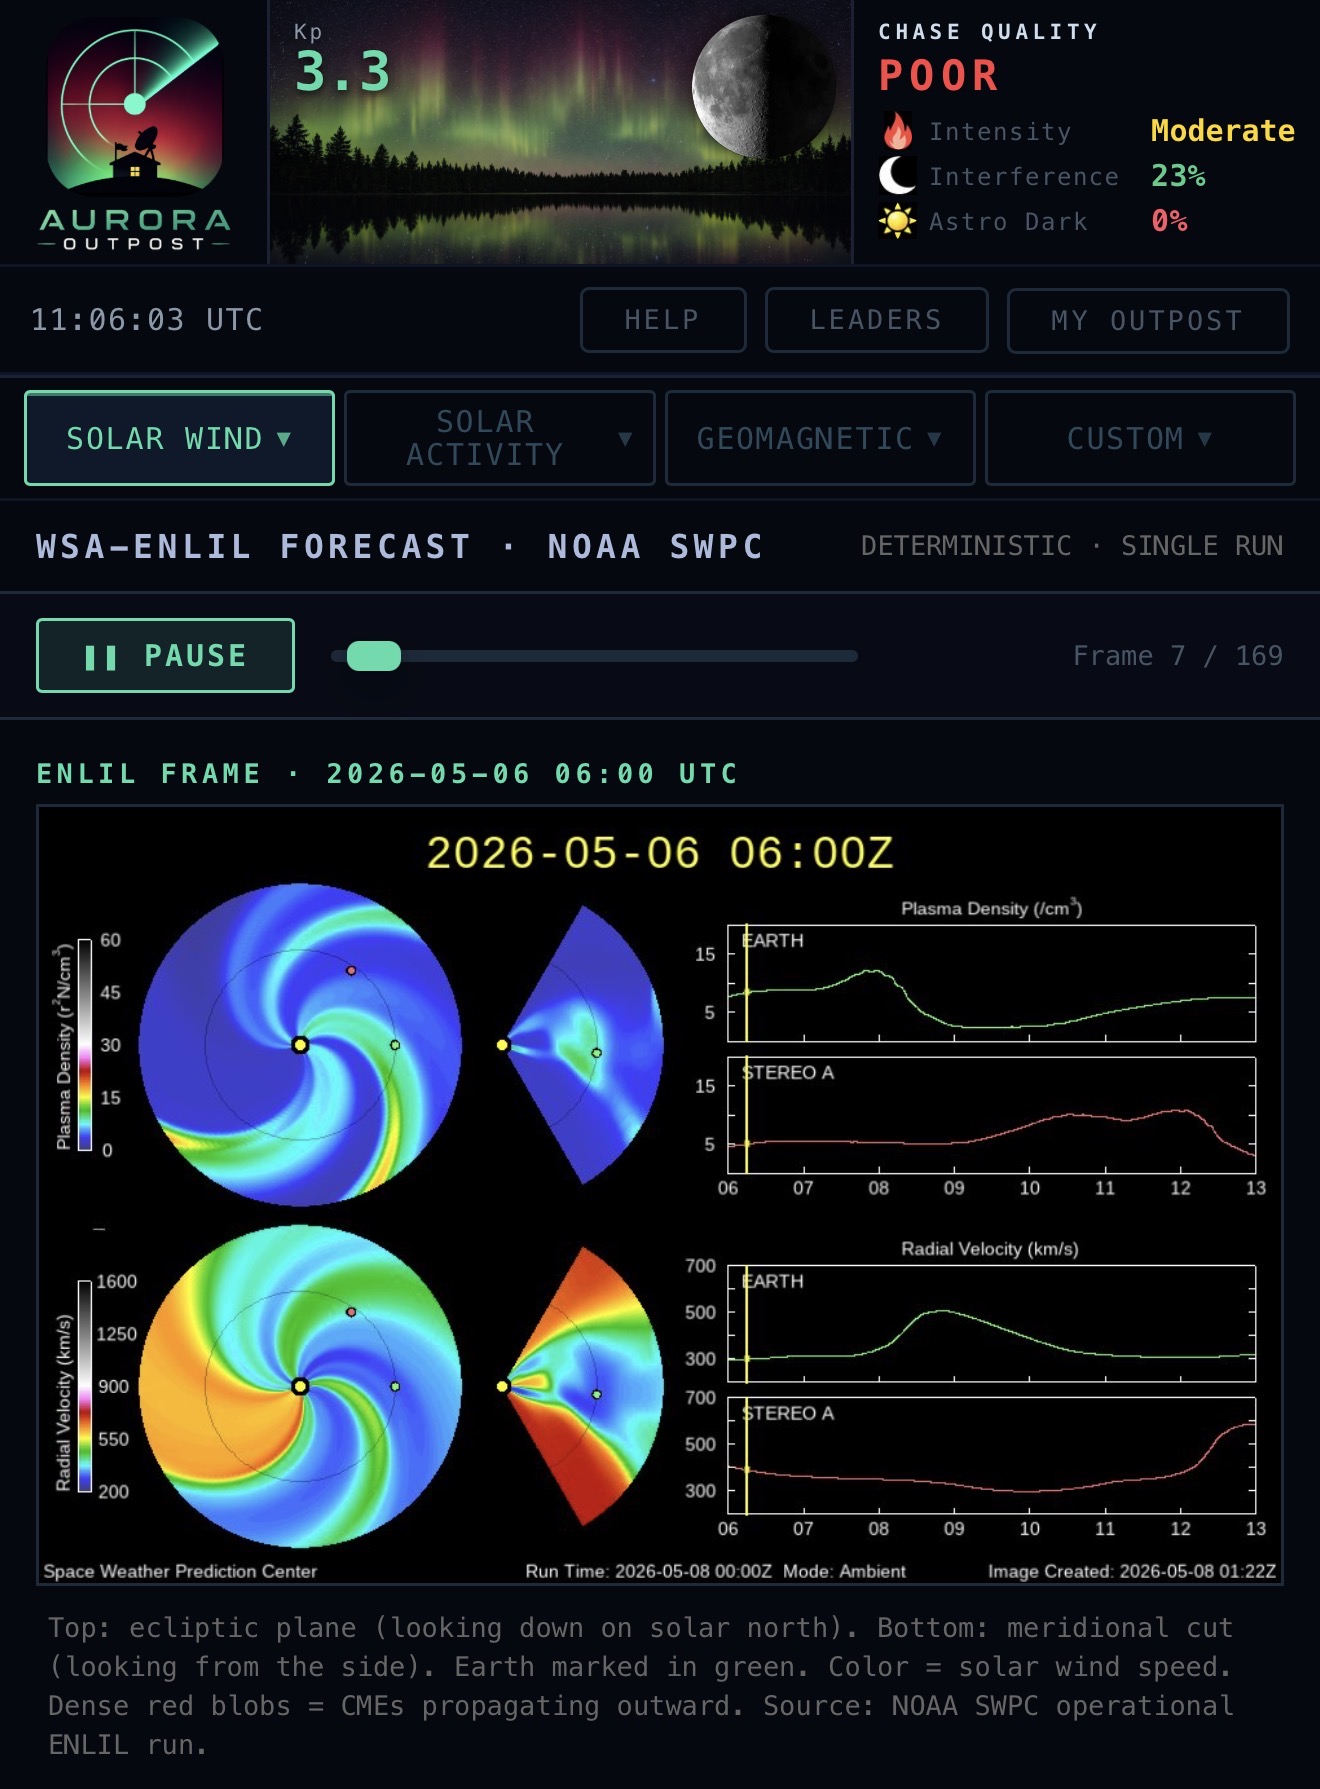
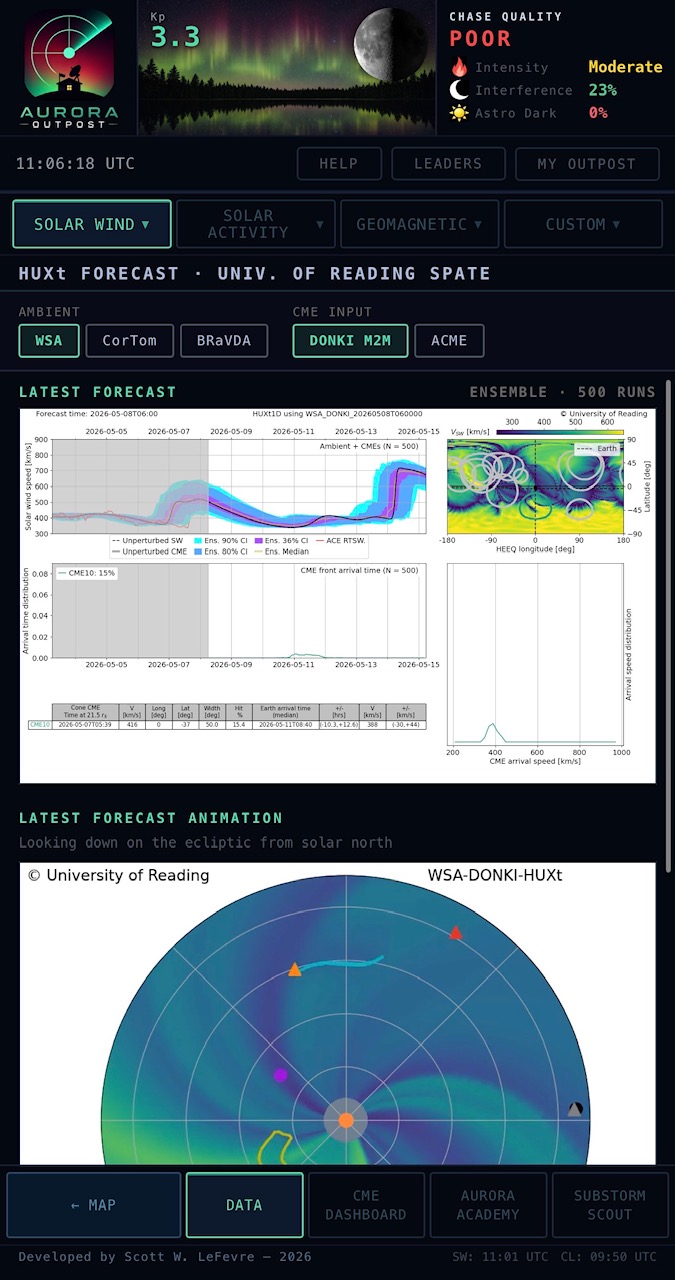
LIVE SW (Bz, By, Bx, Bt, IMF Phi, plasma speed, density, temperature on shared crosshair-synced plots), IMF COMPONENTS (each magnetic-field axis on its own panel for clean reading without overlay clutter), PARTICLES (ACE EPAM electrons + protons with energy bins), WSA-ENLIL (NOAA's deterministic heliospheric forecast embedded as a frame-by-frame animation player — play, pause, scrub through the next 5 days of the model), and HUXt (the University of Reading SPATE group's 500-member ensemble forecast embedded directly — latest forecast image plus animation, with selectable boundary conditions WSA / CorTom / BRaVDA × DONKI / ACME).
Every plot supports time-range zooming (1H / 6H / 24H / 3D / 7D), pinch-zoom on the data area for fine detail on small screens, and your chosen view persists across sessions — reopen the app and your preferred trace toggles, time range, and active sub-page are still there.
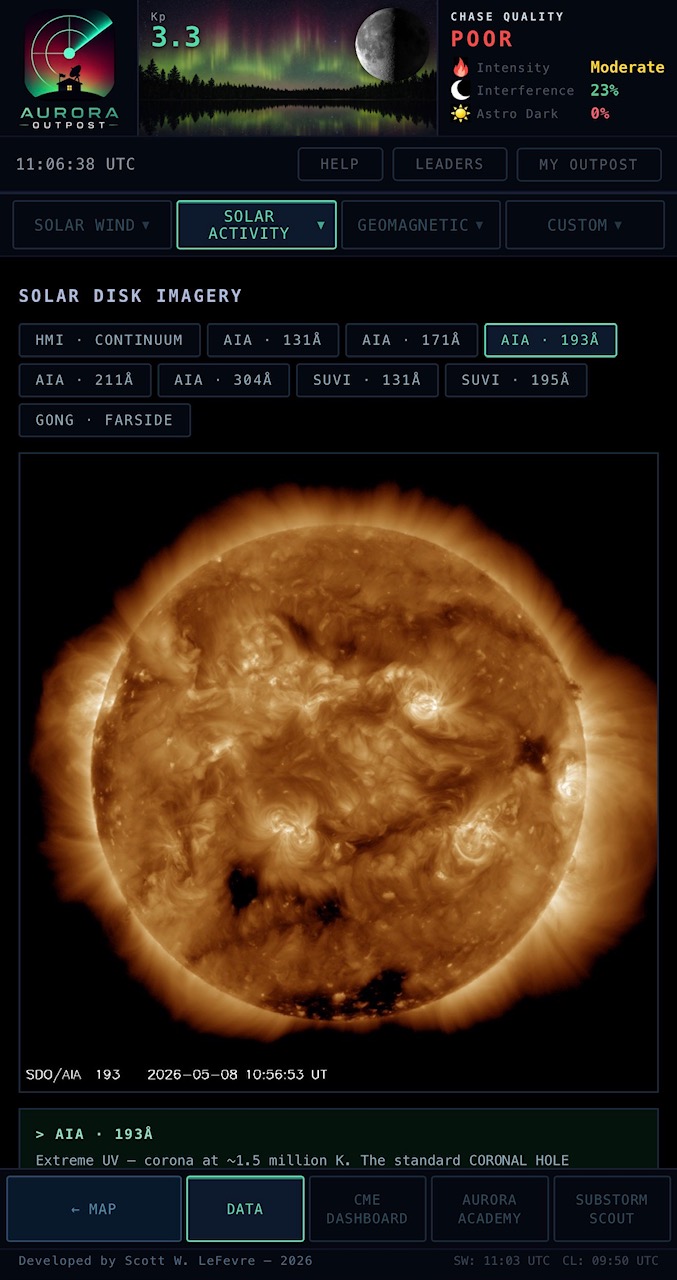
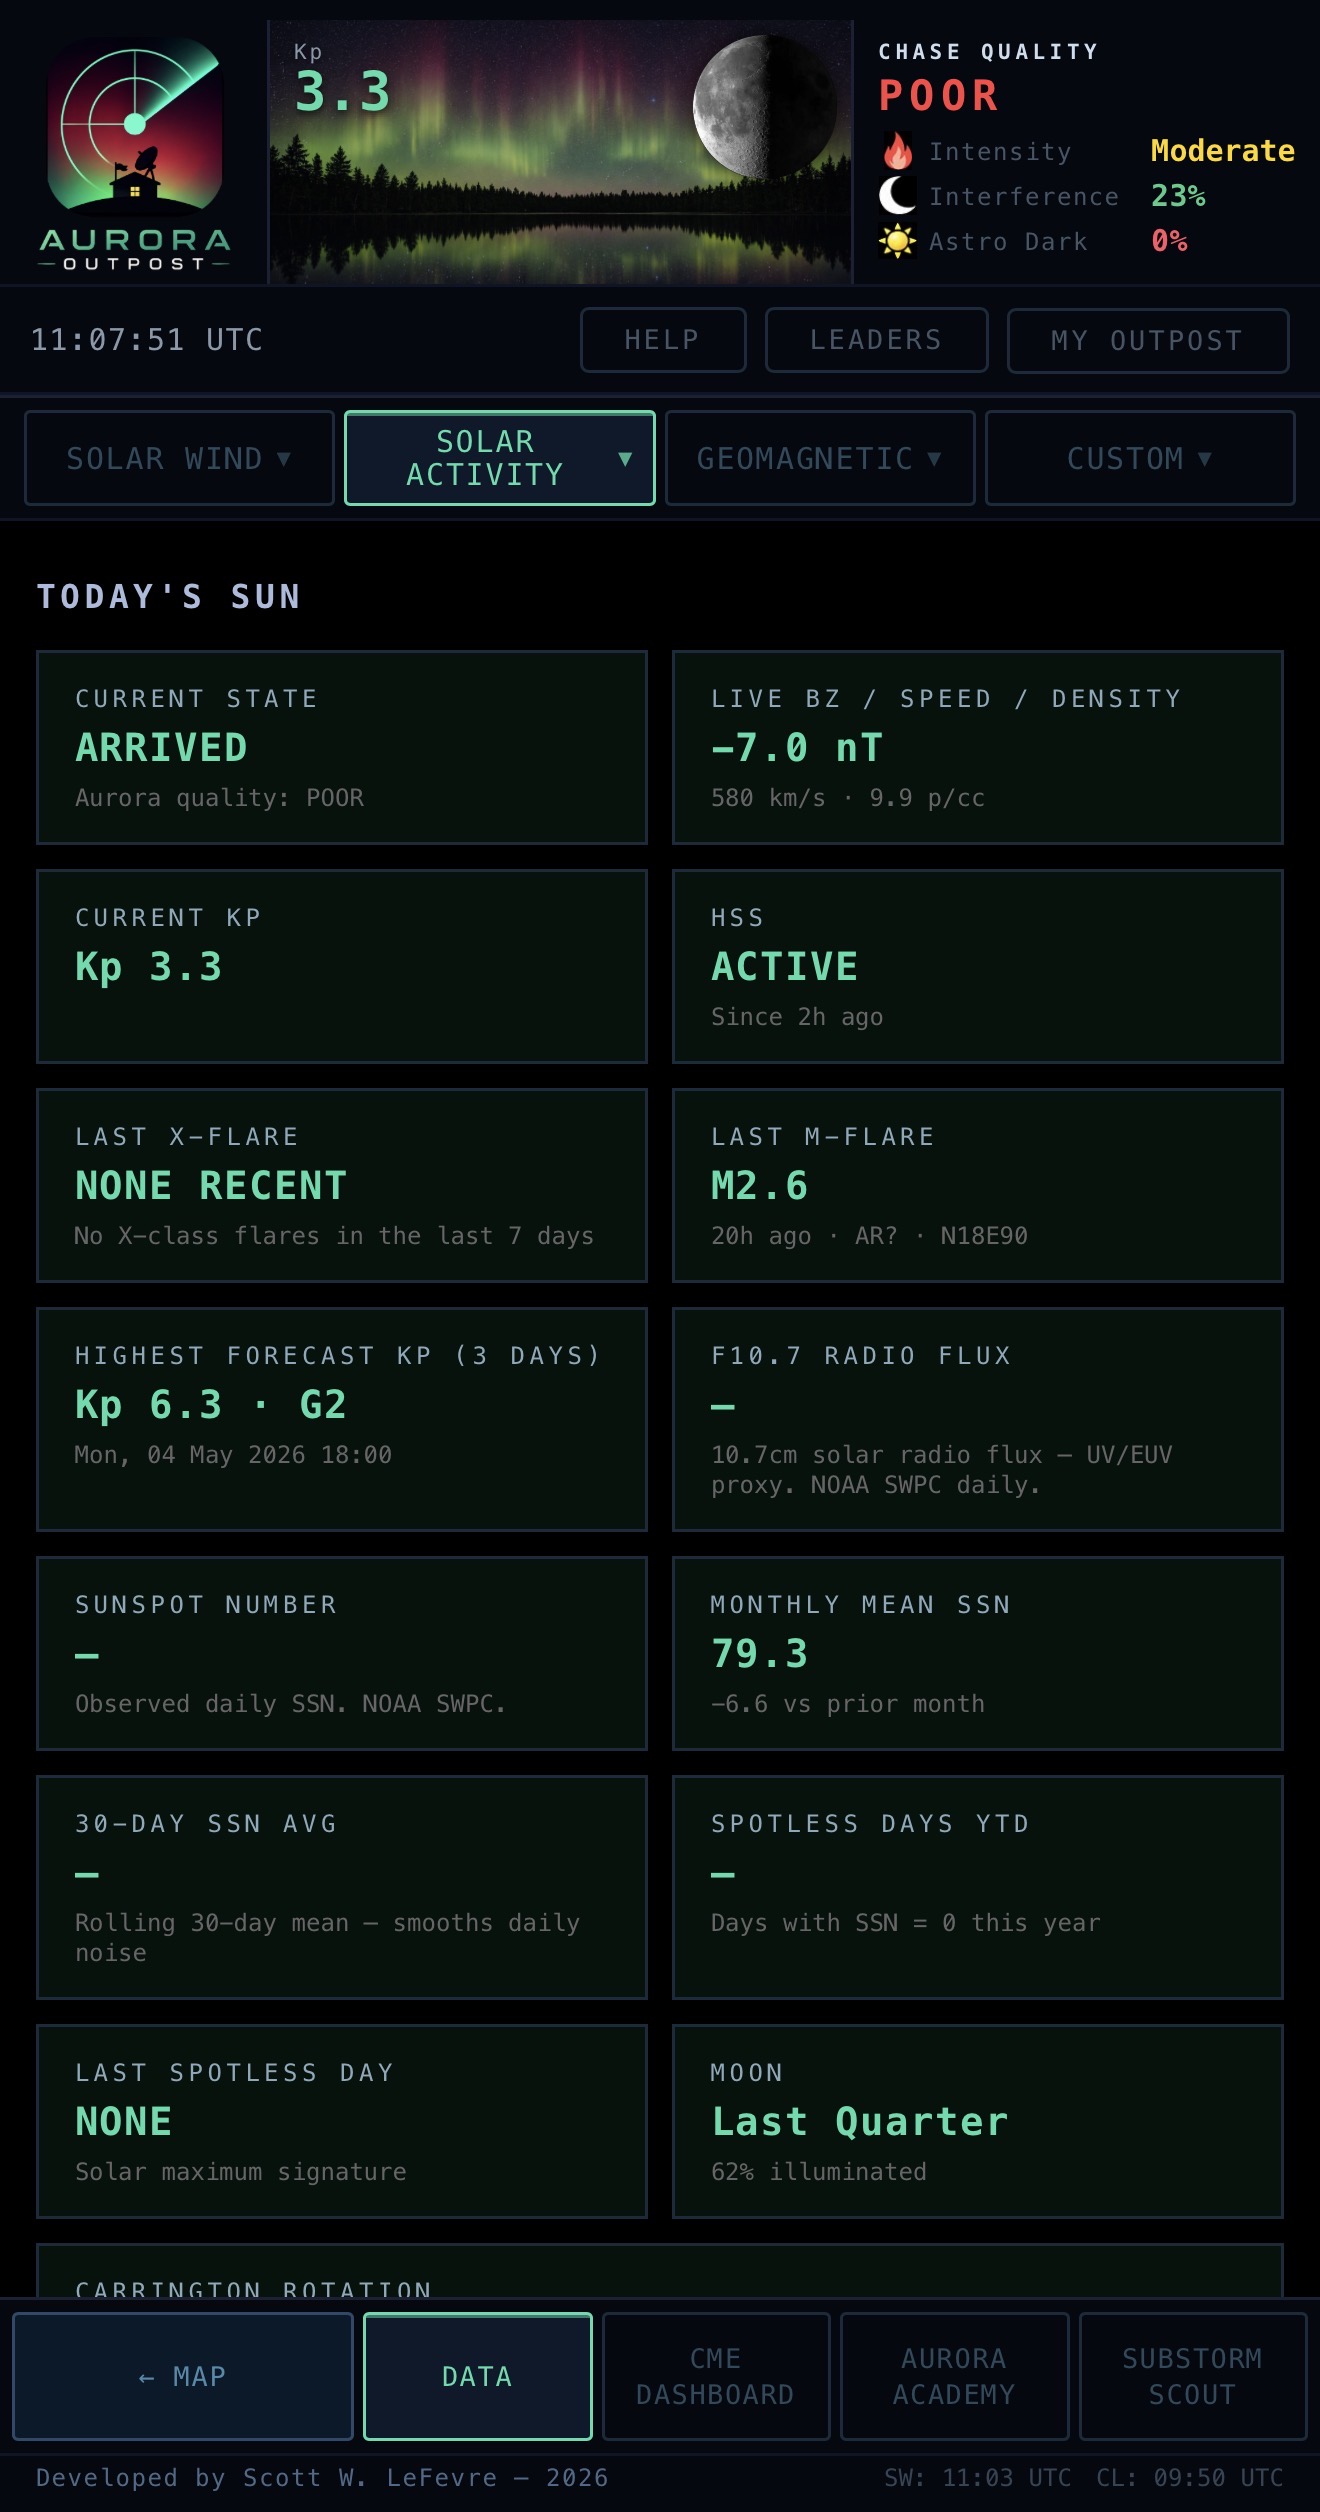
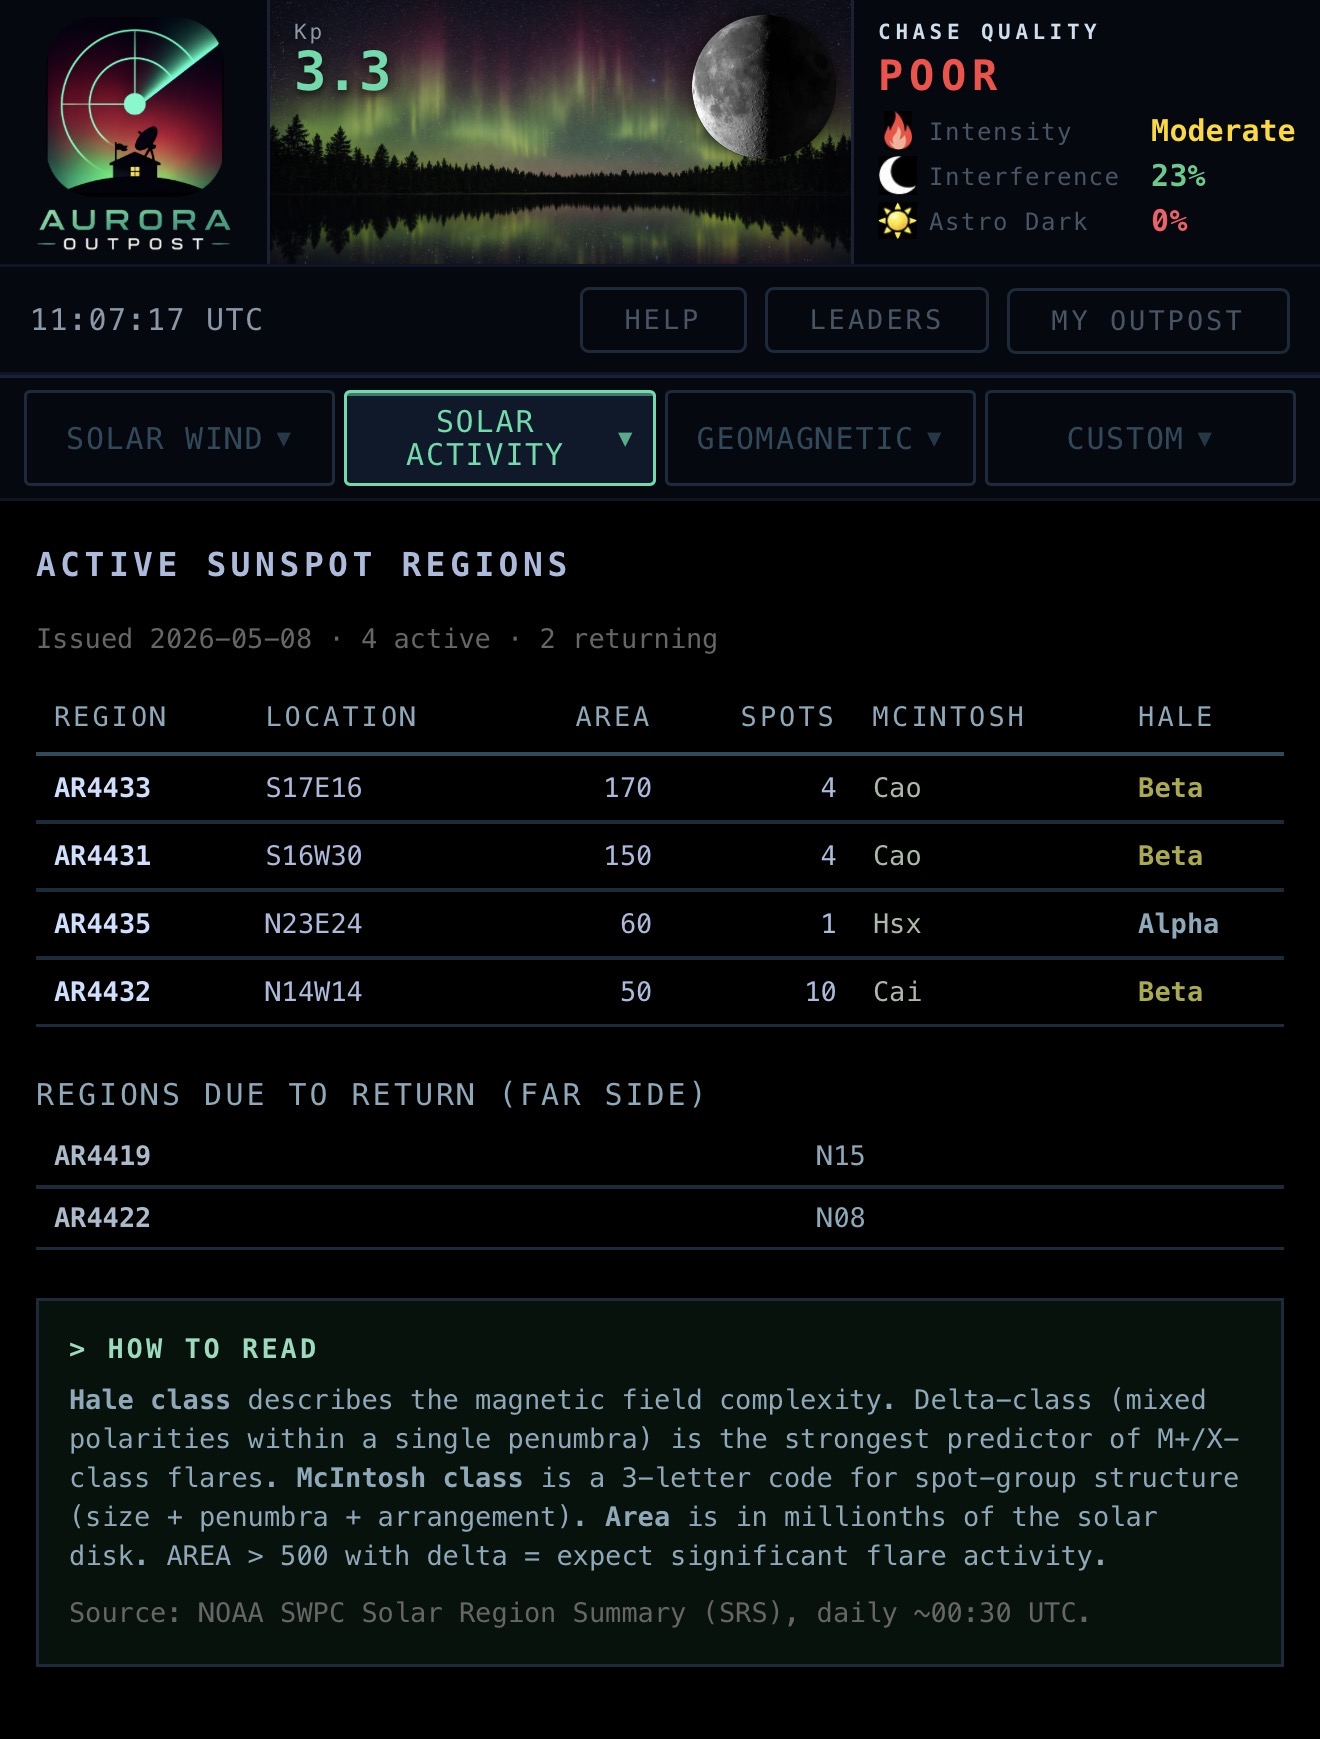
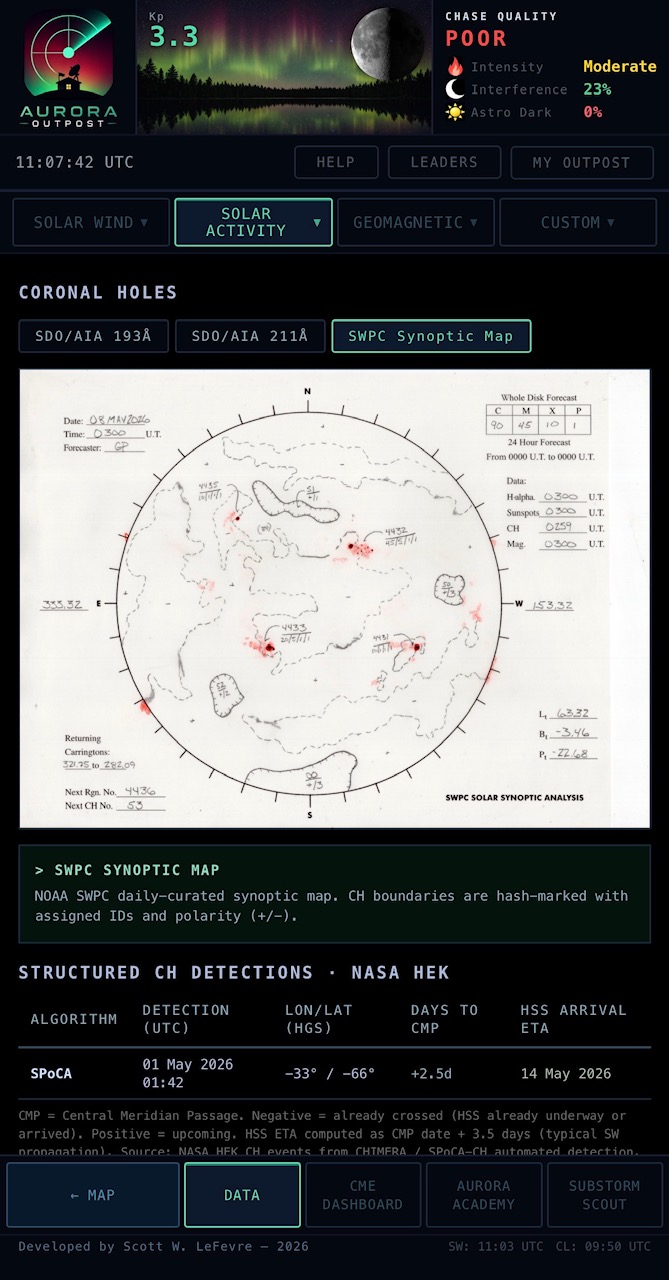
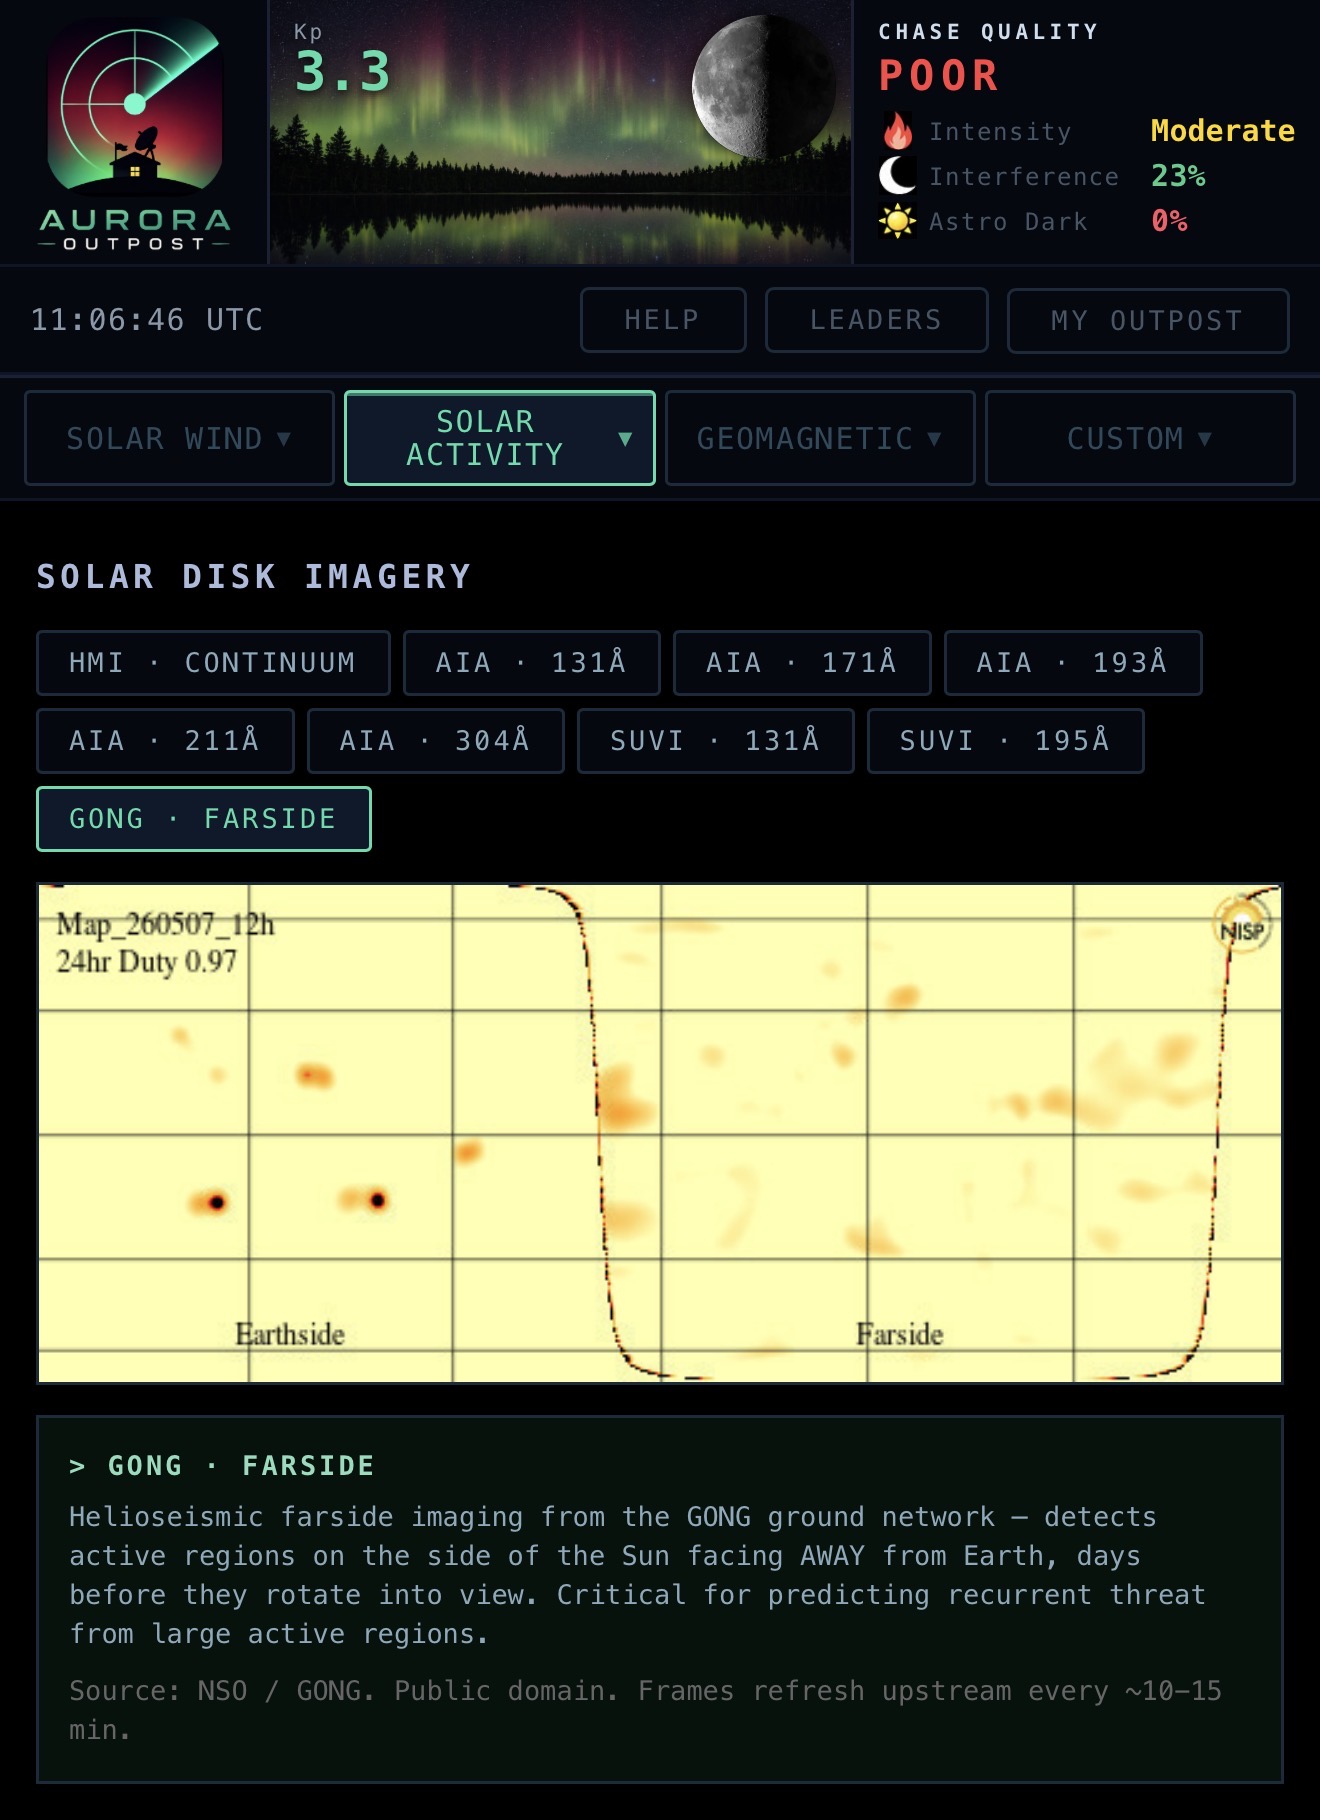
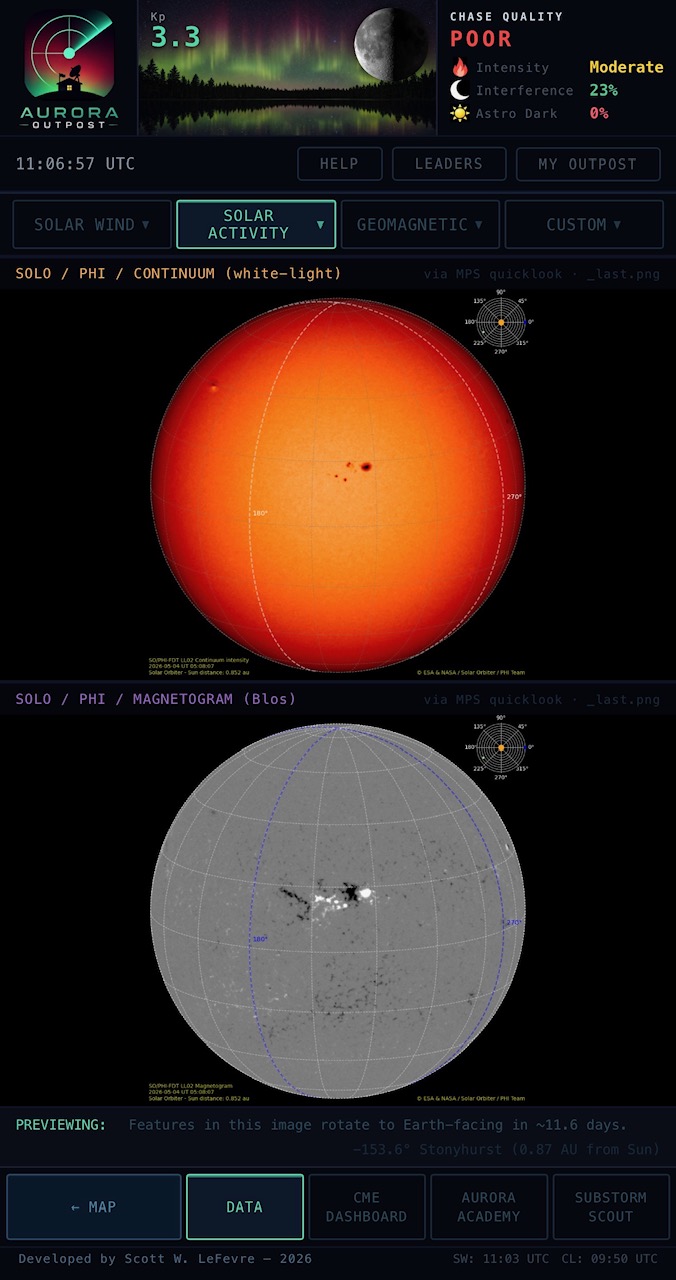
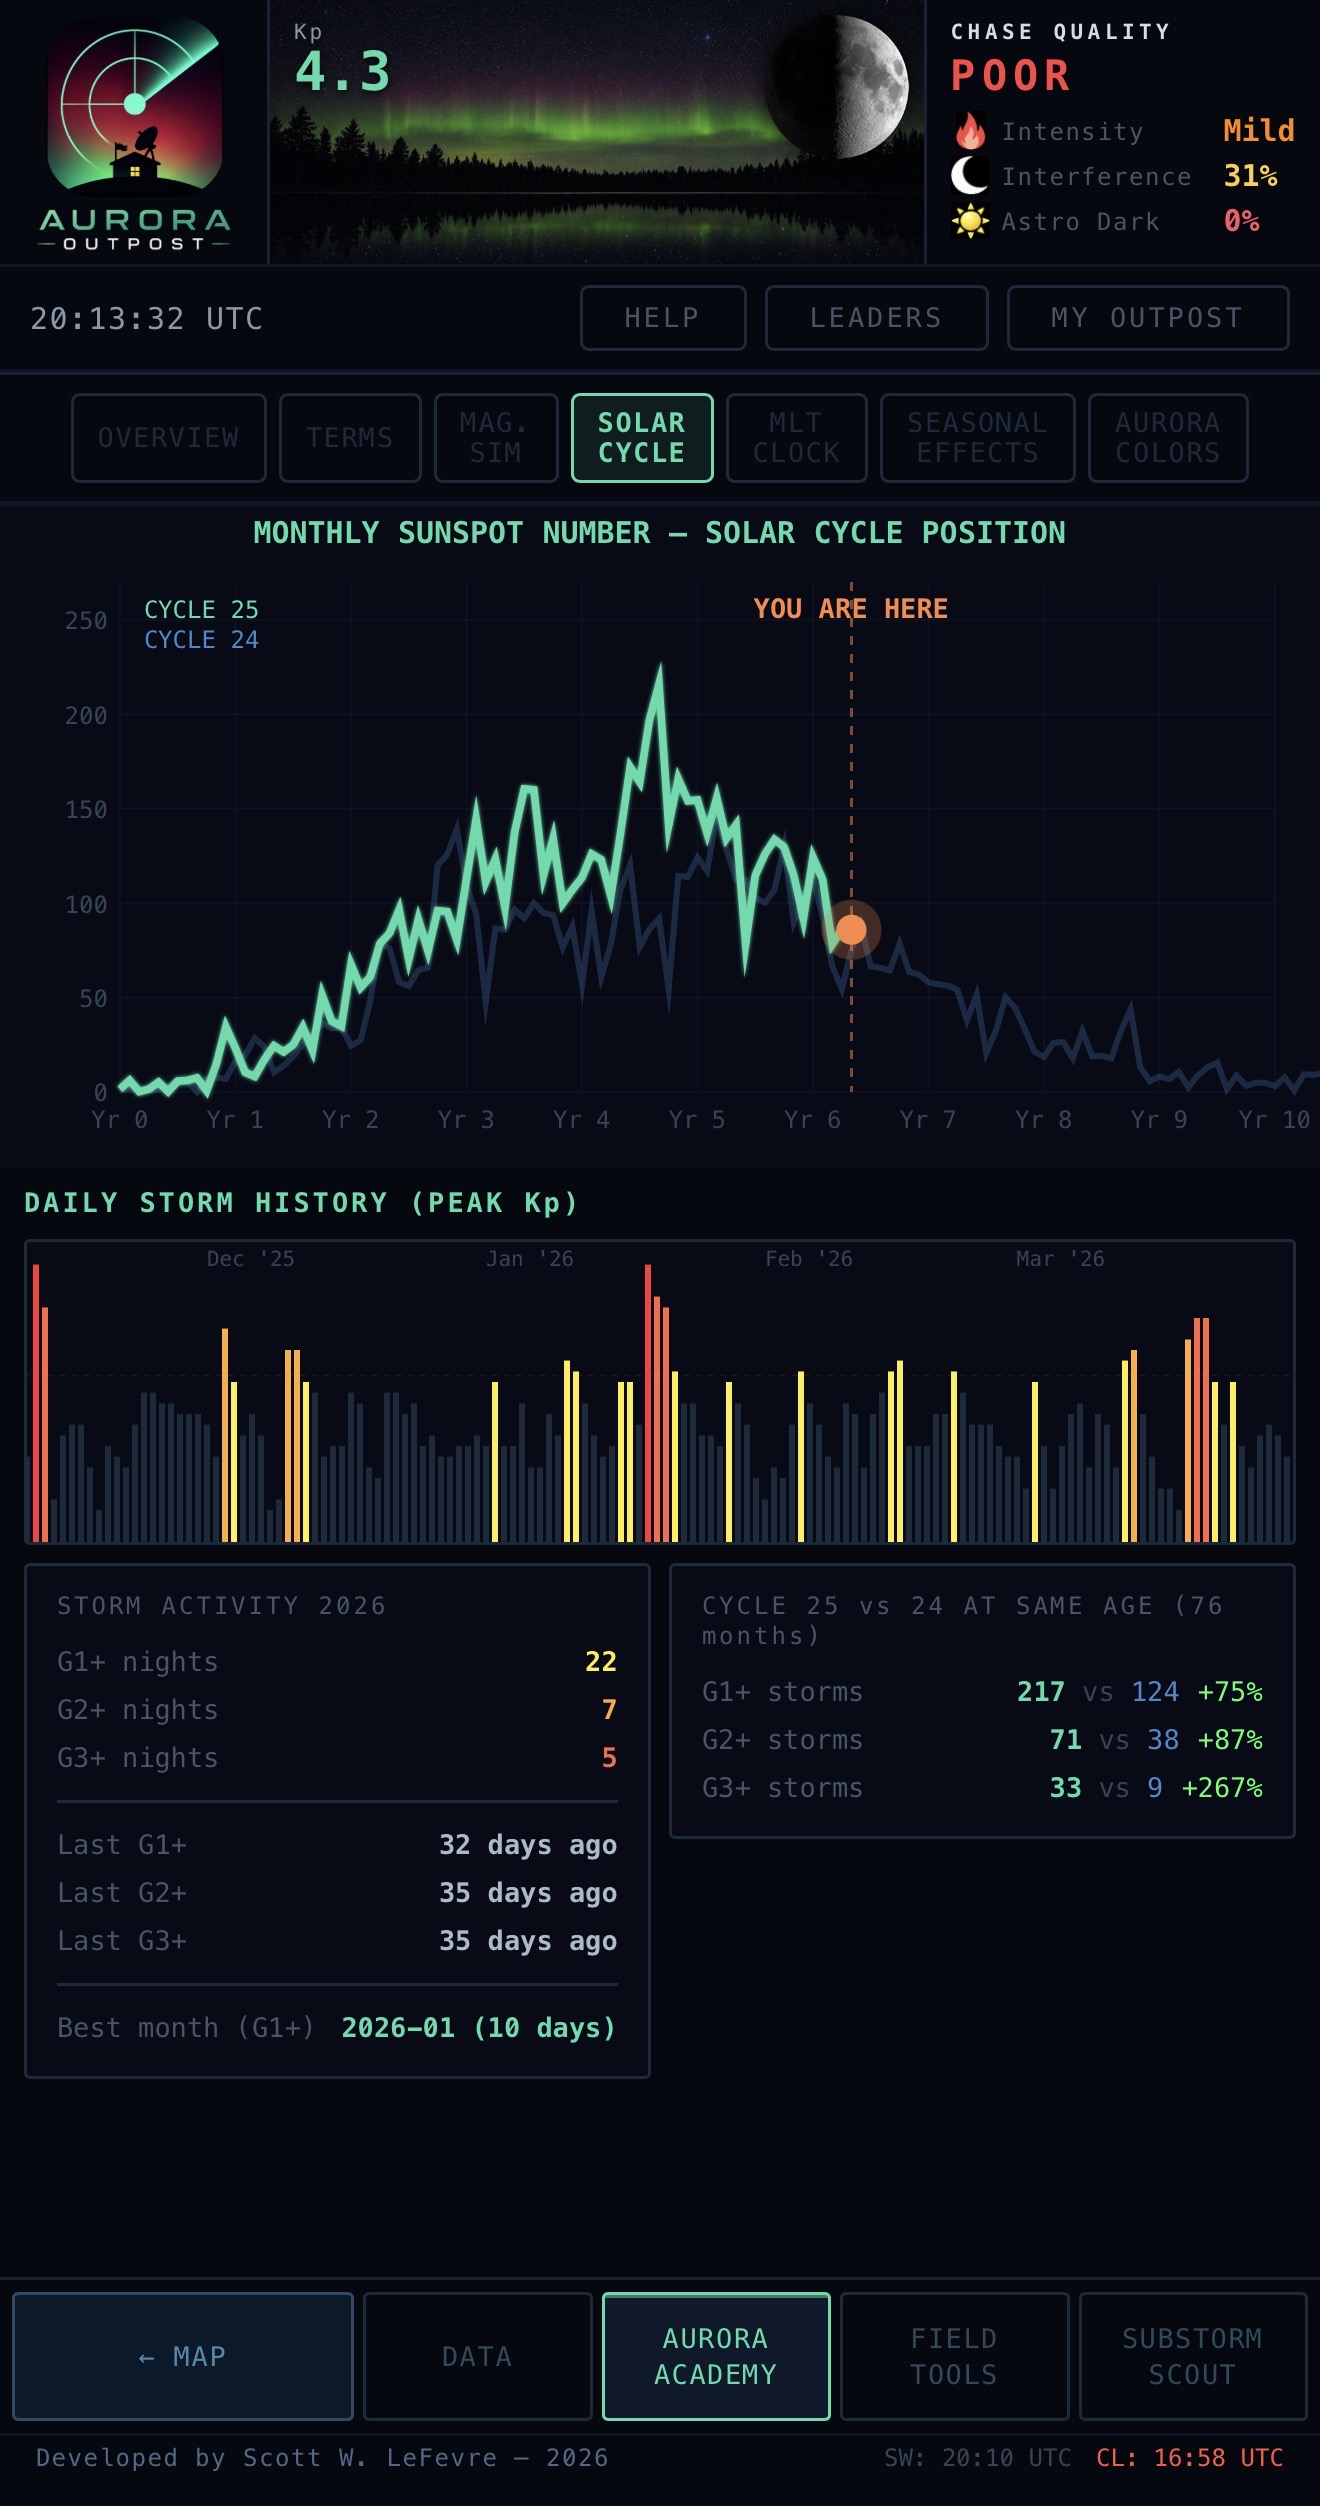
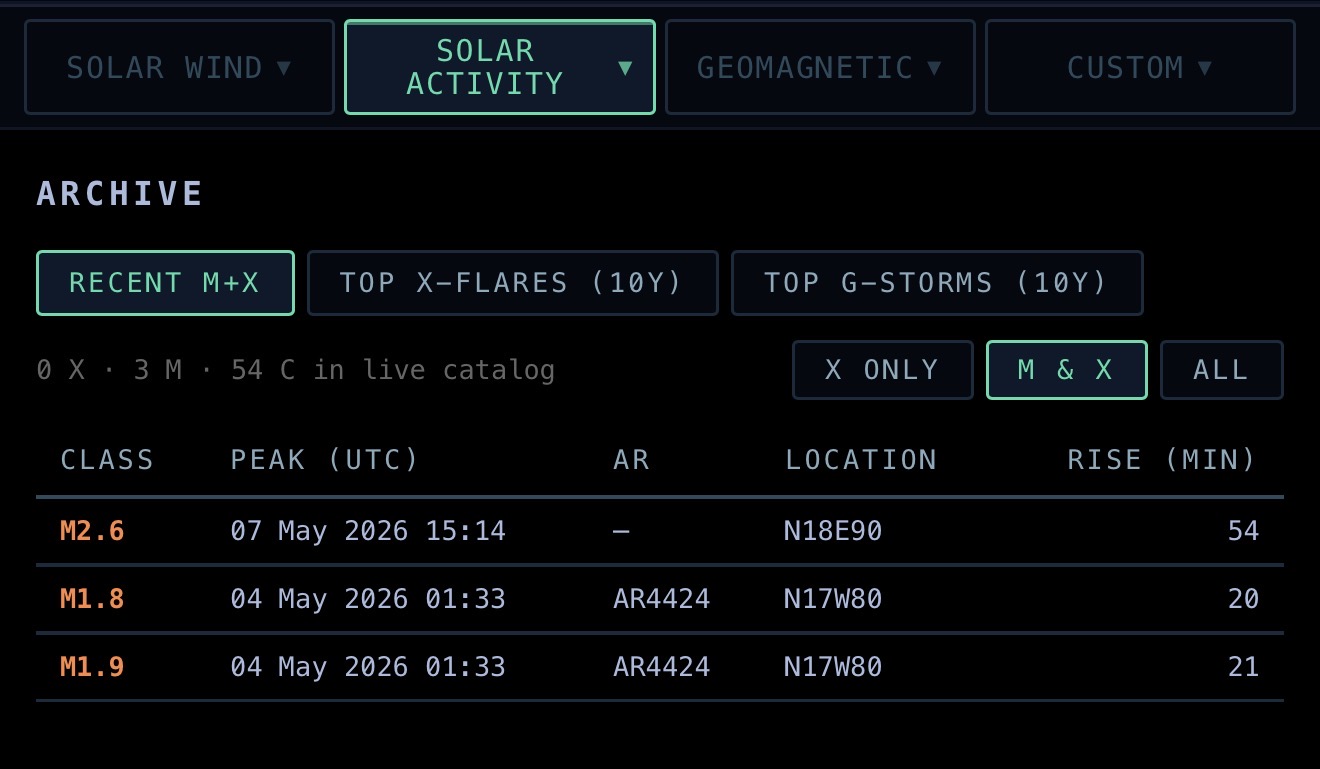
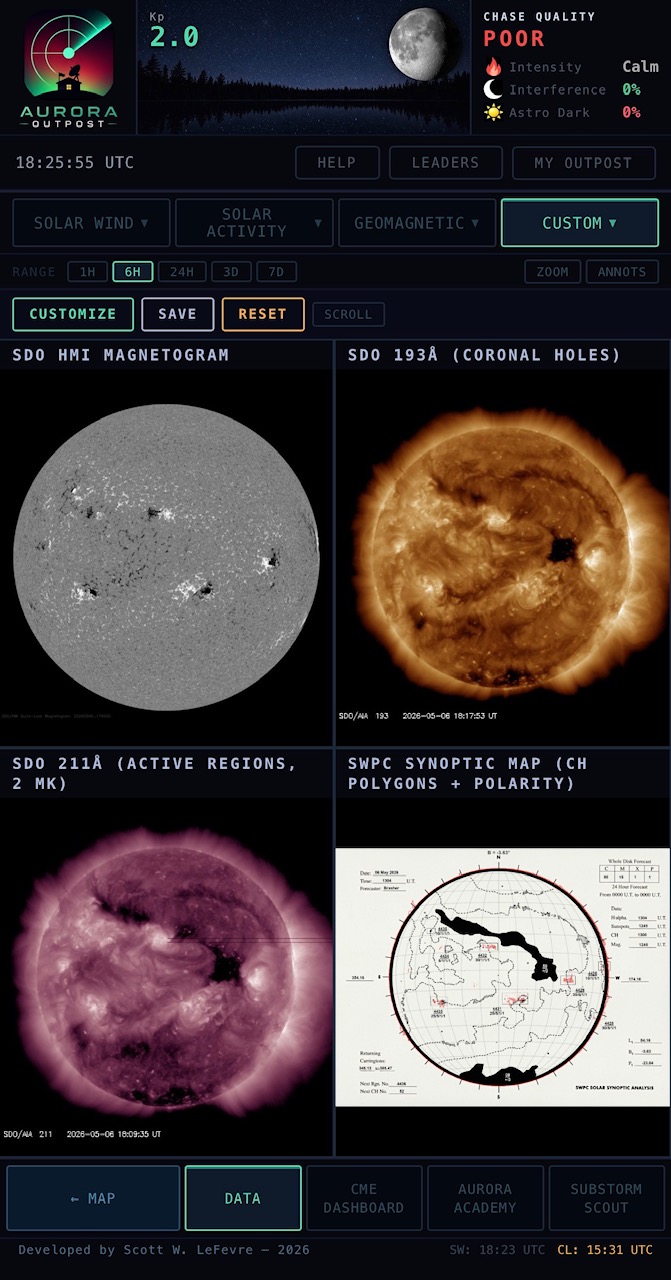
IMAGERY (multi-wavelength SDO disk: continuum, HMI magnetogram, 304 Å, 171 Å, 193 Å, 131 Å with toggleable wavelengths), SOLO PHI (Solar Orbiter continuum + magnetogram with live Stonyhurst-longitude readout telling you when Sun-facing features rotate to Earth), SUNSPOTS (NOAA SWPC daily Solar Region Summary parsed into a live active-region table with Hale + McIntosh classifications, delta-class flagged for X-flare risk), FLARES (X-ray flux + last-7-days flare browser with SDO 131Å region cutouts), CORONAL HOLES (HEK detections from SPoCA + CHIMERA with central-meridian crossing and HSS arrival forecast), TODAY'S SUN (one-card snapshot of cycle phase, F10.7, sunspot number, last X / M flares, last storm), SOLAR CYCLE (Cycle 25 plotted against historical cycles + Kp record, “you are here” marker), and ARCHIVE (top 50 X-flares + top 50 G-storms from NASA DONKI for pattern-matching against the current event).
The SOLO PHI page is the off-the-beaten-path one: ESA's Solar Orbiter sits well off the Sun-Earth line in a tilted heliocentric orbit, so its onboard PHI imager often sees parts of the solar surface that haven’t yet rotated to face Earth. The footer computes the orbiter’s heliographic Stonyhurst longitude in real time from JPL Horizons ephemeris and tells you the answer chasers actually want: “Features in this image rotate to Earth-facing in ~N days.” When SOLO is east of Earth, today’s magnetogram is a multi-day preview of incoming active-region polarity — the leading indicator of CME Bz orientation if any of those regions erupt.
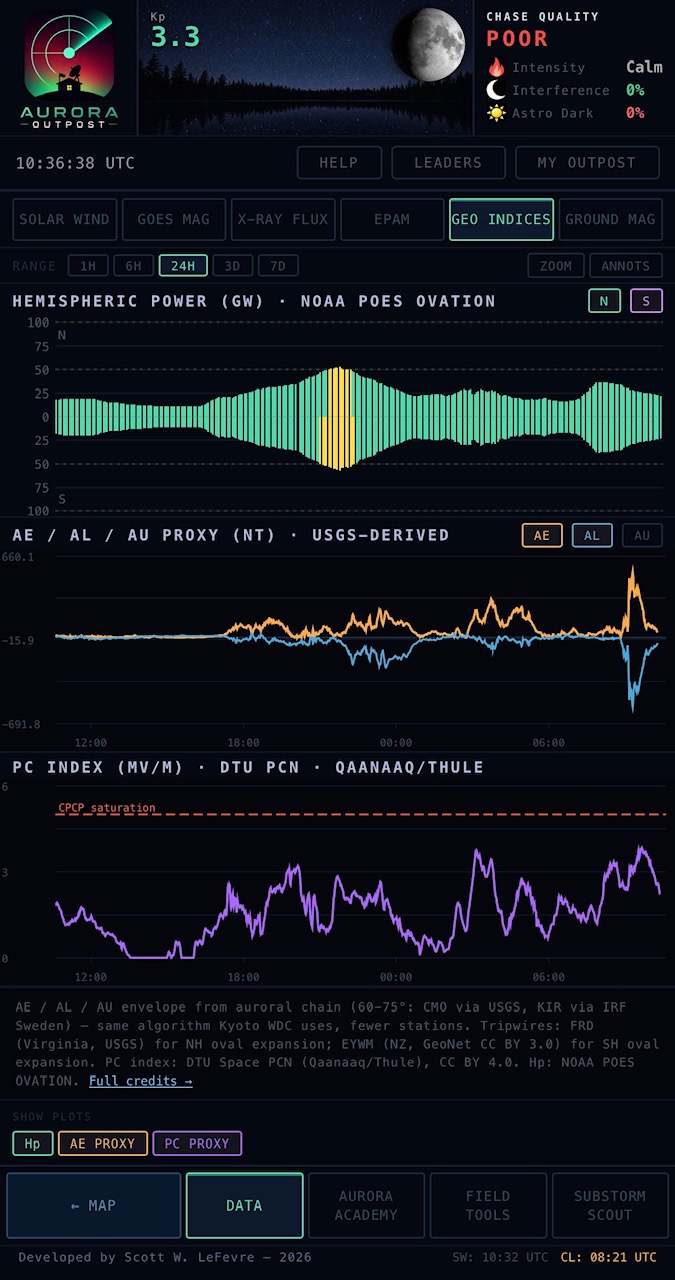
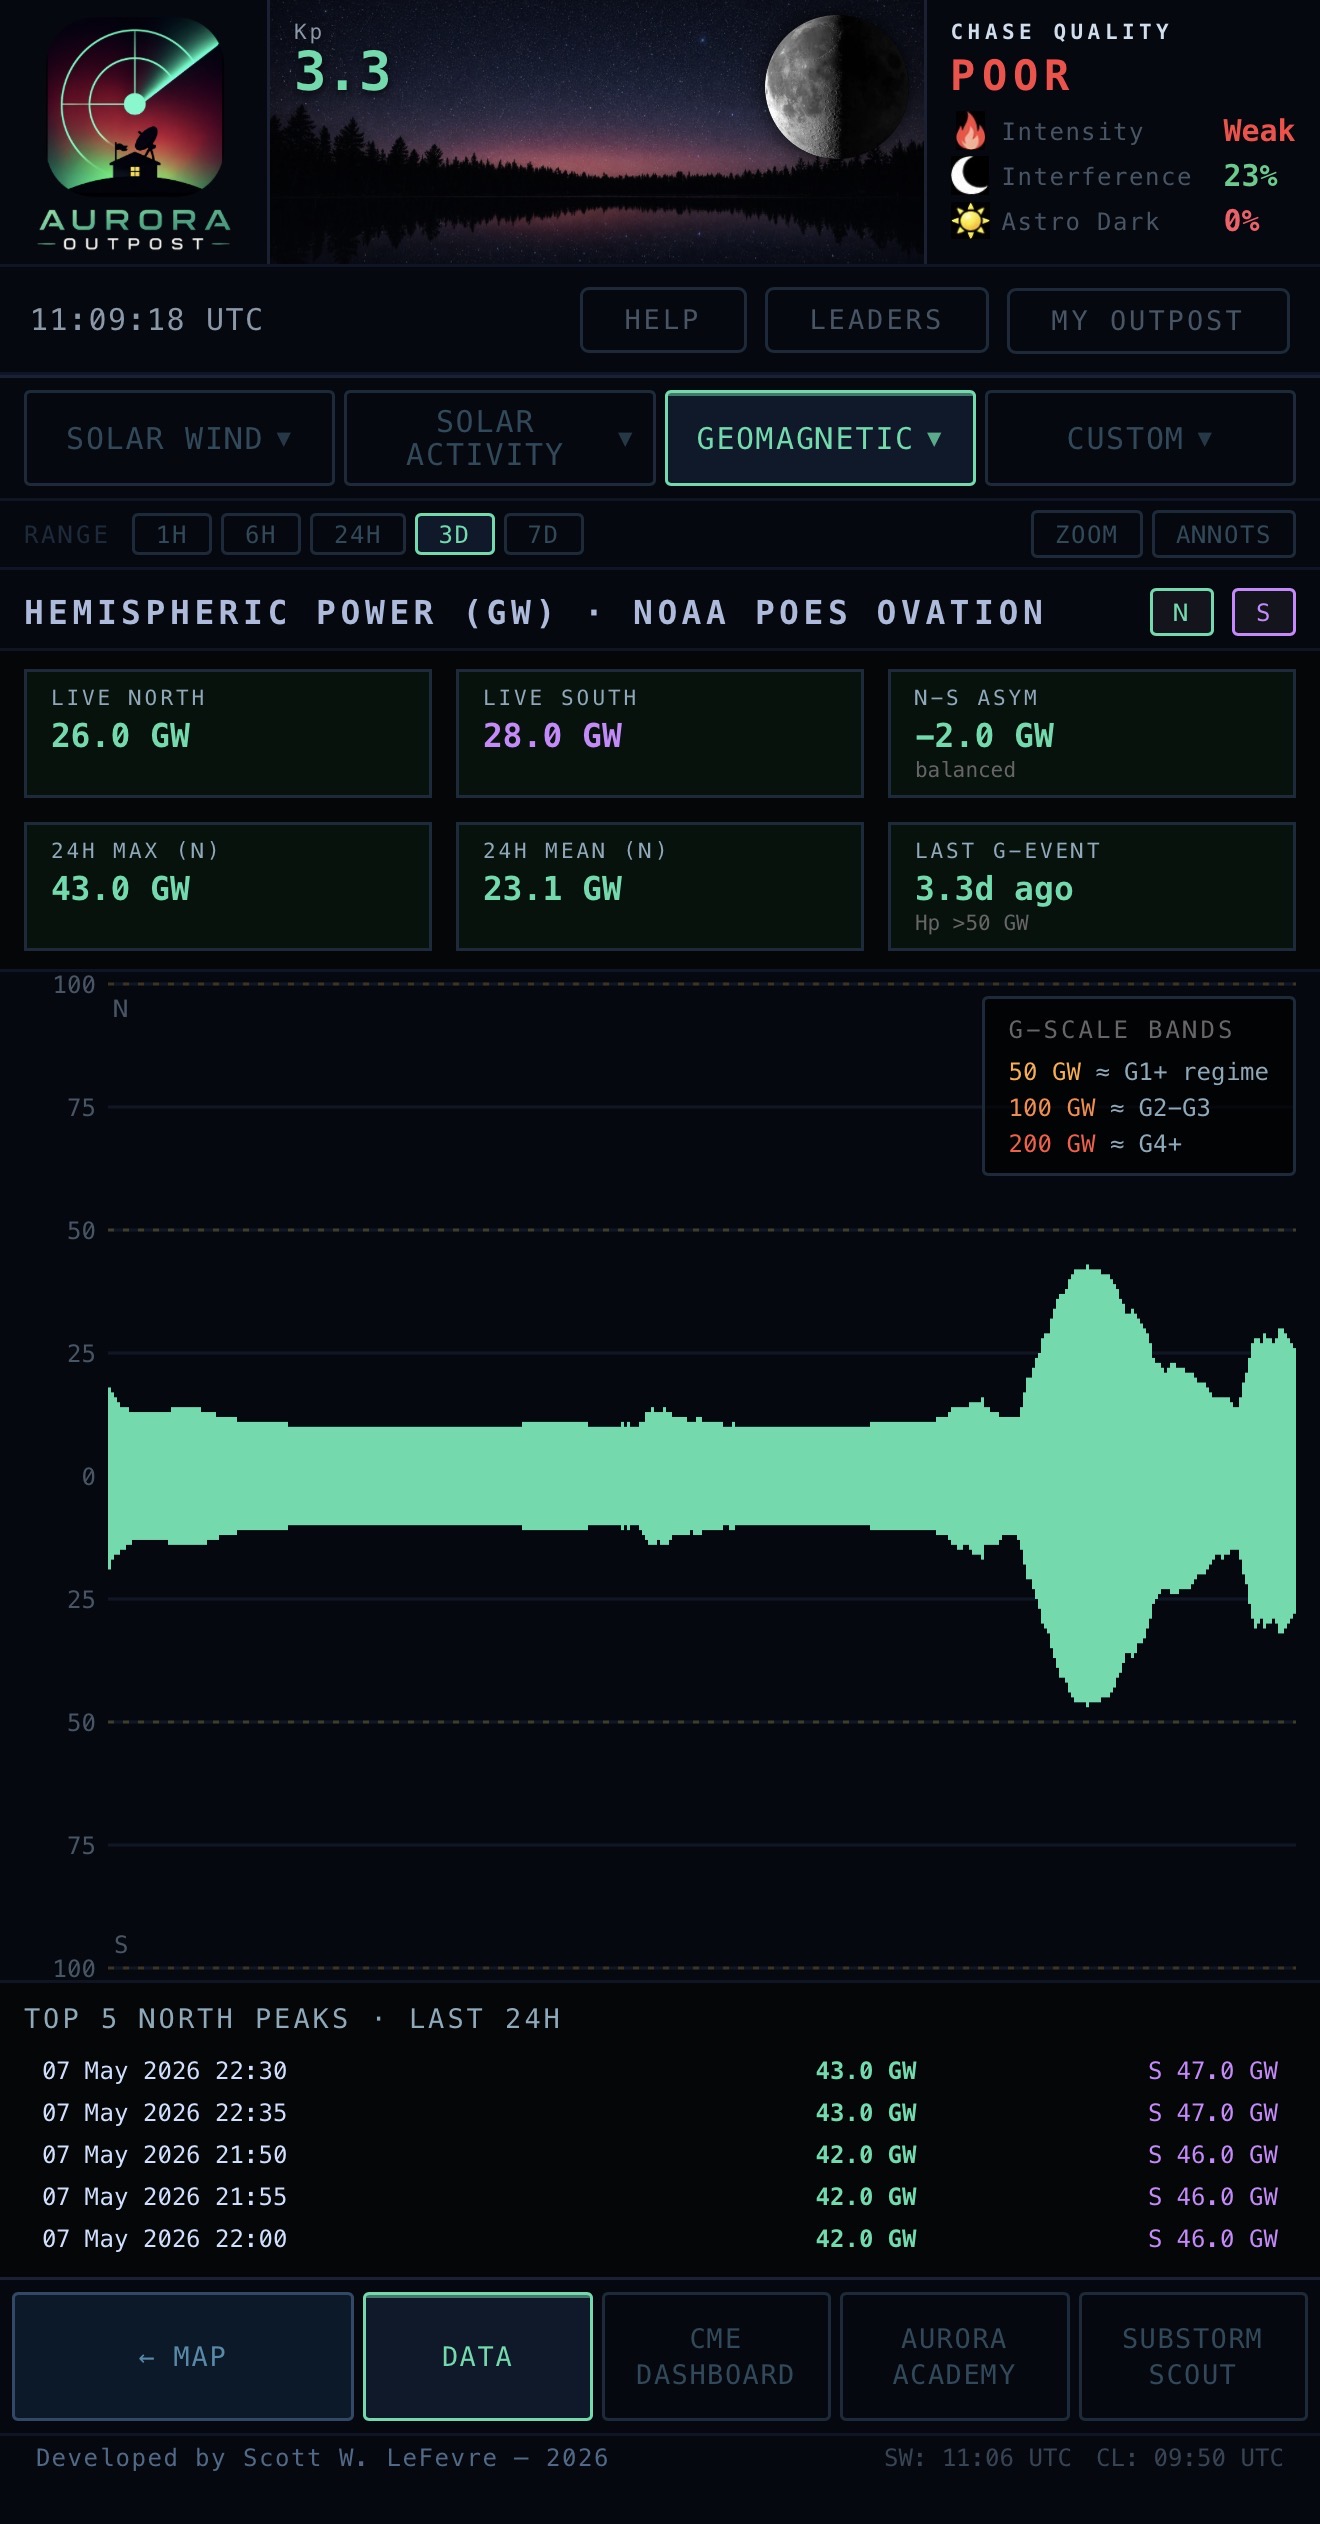
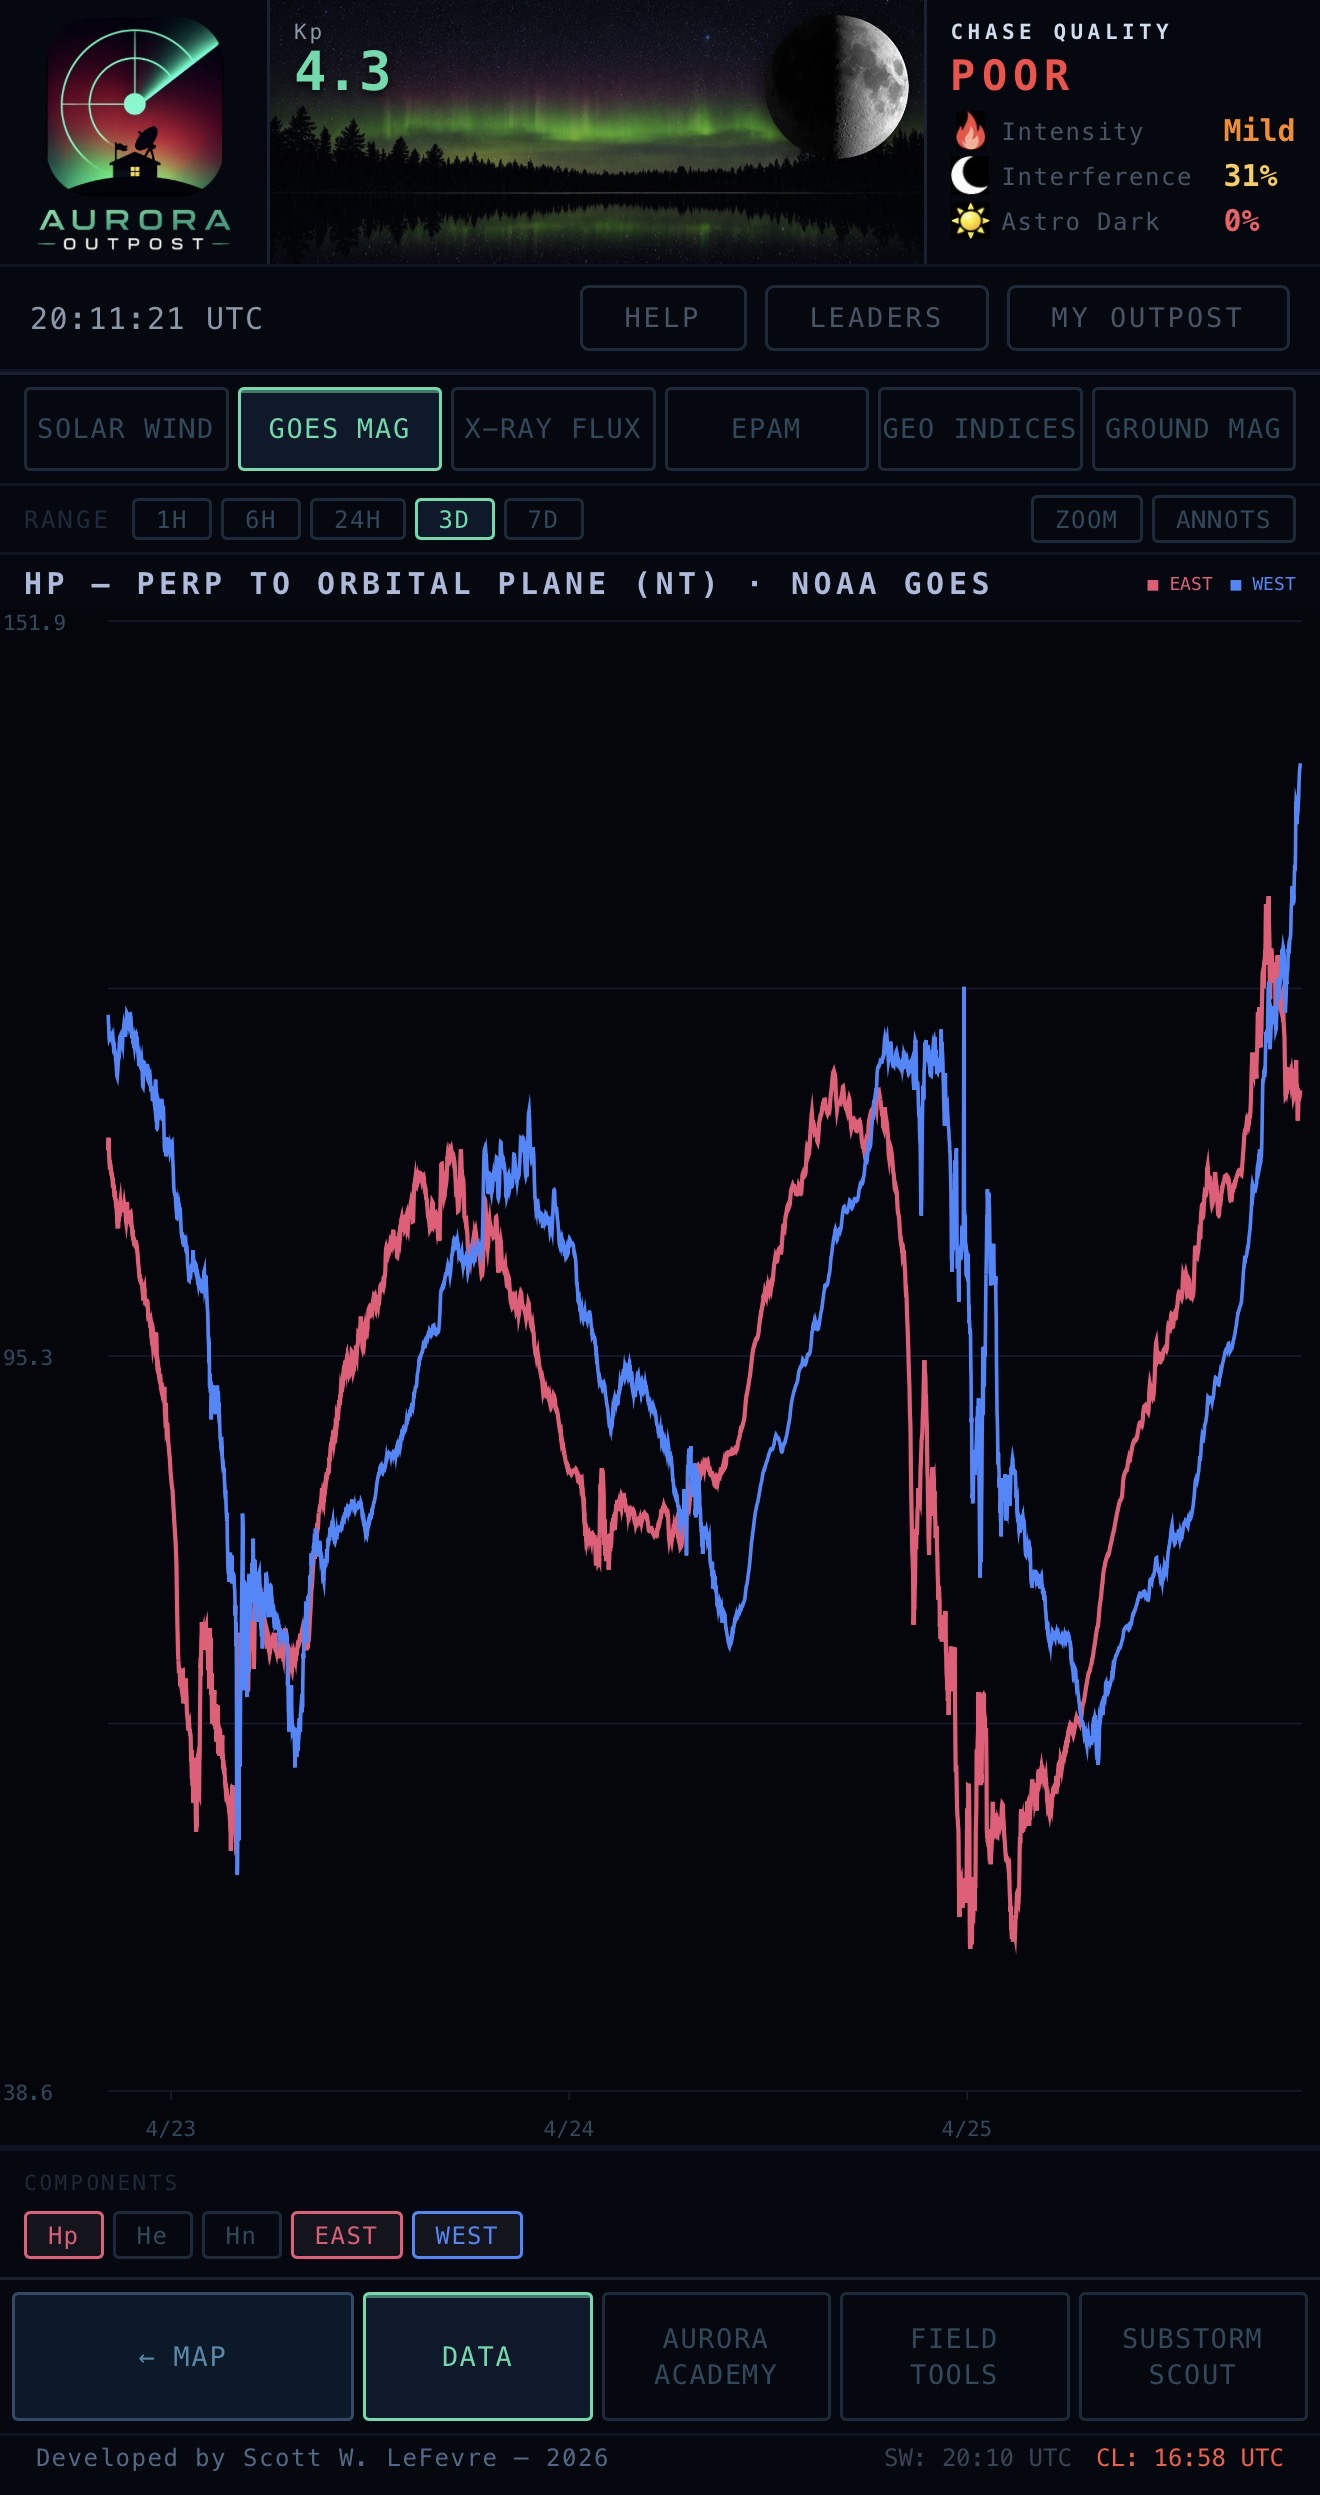
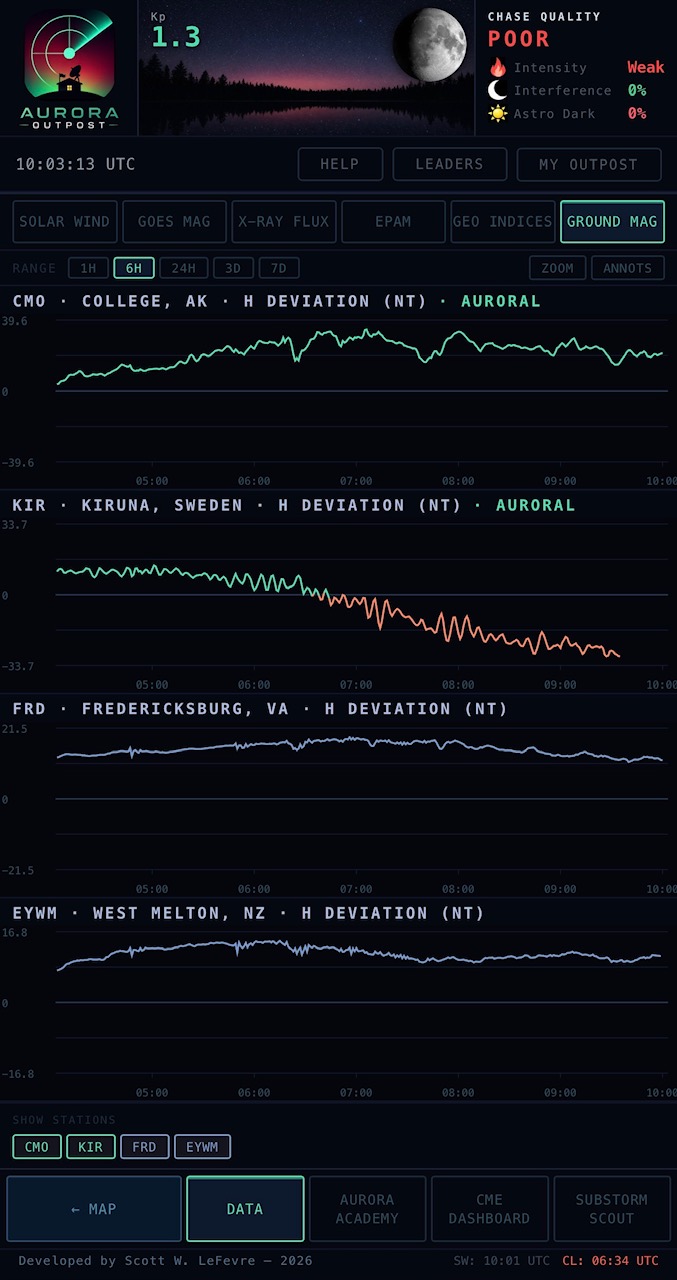
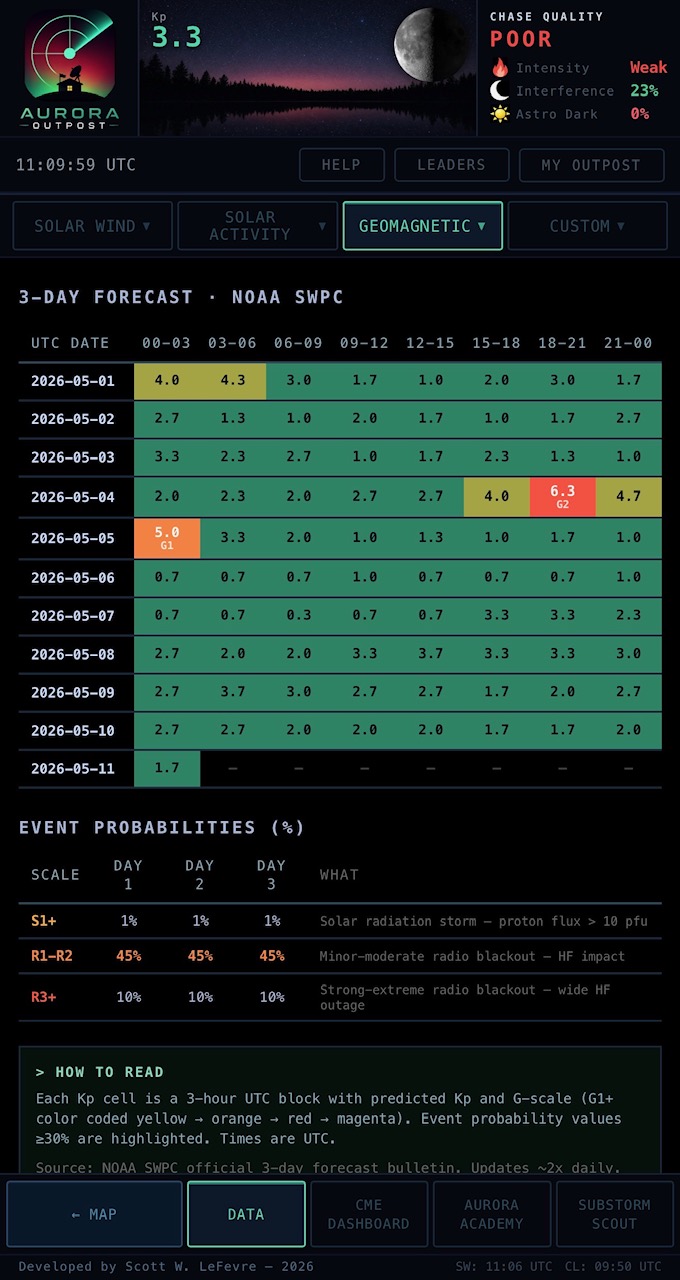
GOES MAG (geosynchronous Hp / He / Hn from primary + secondary), INDICES (Kp, Hp30/60, AE/AL/AU envelope from auroral chain, SNAP polarity), GROUND MAG (terrestrial magnetometer chain — CMO, KIR, FRD, EYWM), HEMISPHERIC POWER (NOAA POES OVATION HP with N/S asymmetry, 24h peaks list, time-since-last-G readout, G-scale band overlay), POLAR CAP INDEX (DTU Space PCN from Qaanaaq with CPCP saturation banner), and 3-DAY FORECAST (NOAA SWPC bulletin parsed into a structured table).
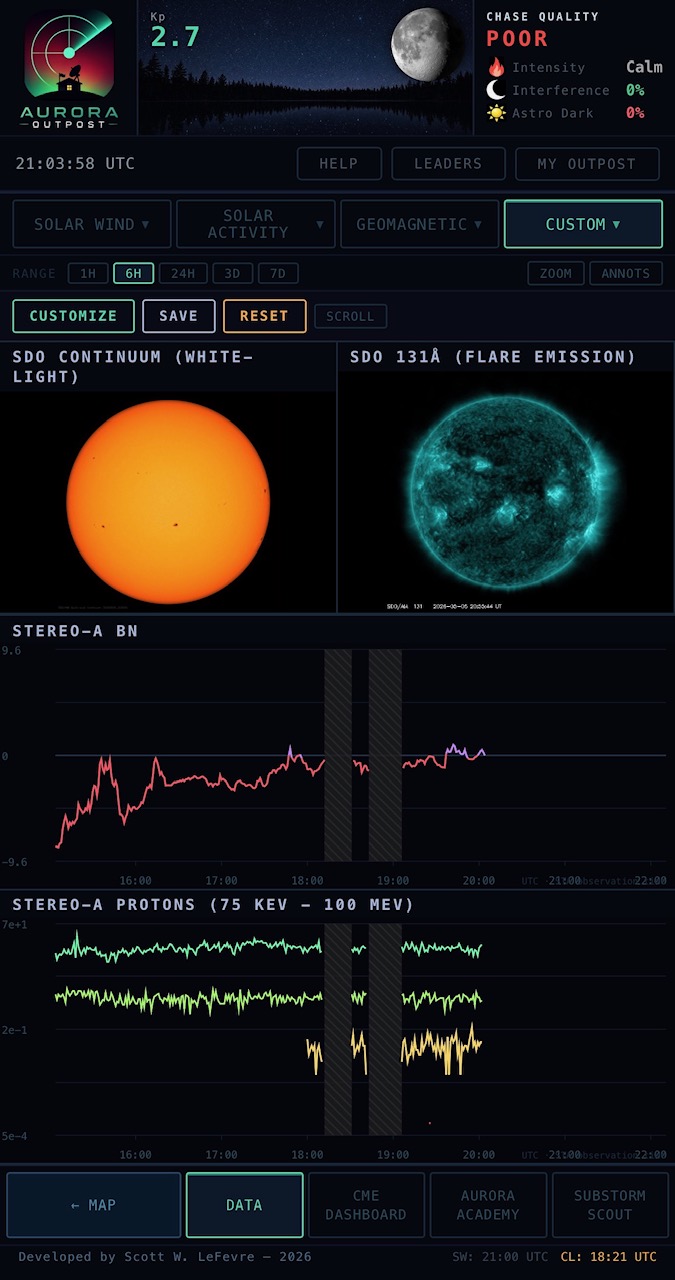
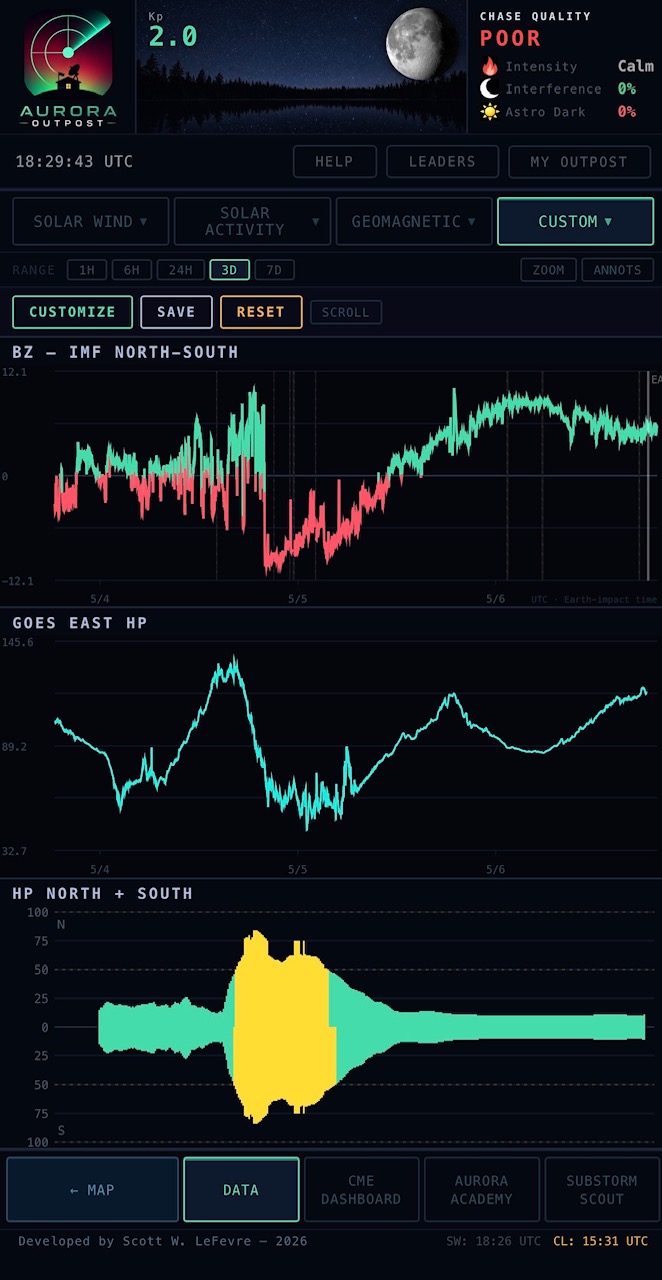
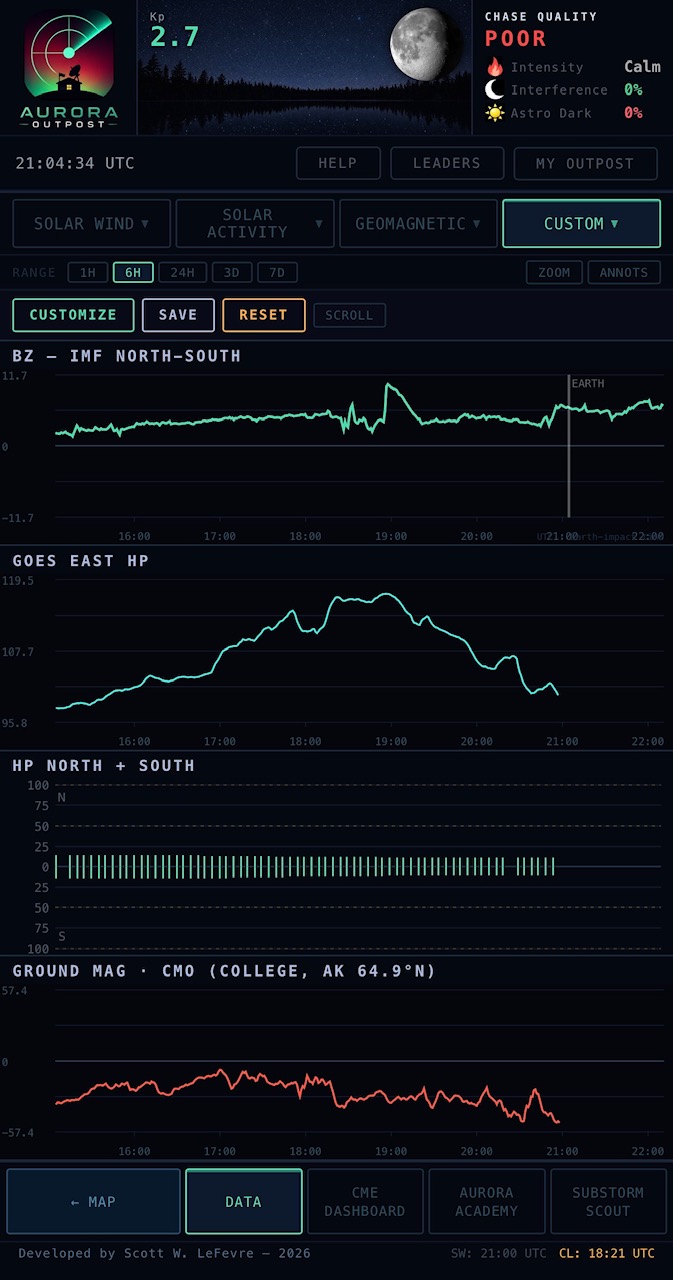
Build your own multi-plot view from any combination of pipeline outputs — IMF components, plasma, GOES Hp, hemispheric power, AE/AL/AU, PC, STEREO-A, ground magnetometers, SDO multi-wavelength imagery, 3-day Kp/S/R forecast. Pick what matters to you tonight, save the layout, and your custom dashboard persists across sessions. Combine images and plots side-by-side; pick a time range that applies to every panel at once. Multi-source crosshair stays synced across every plot in the layout.
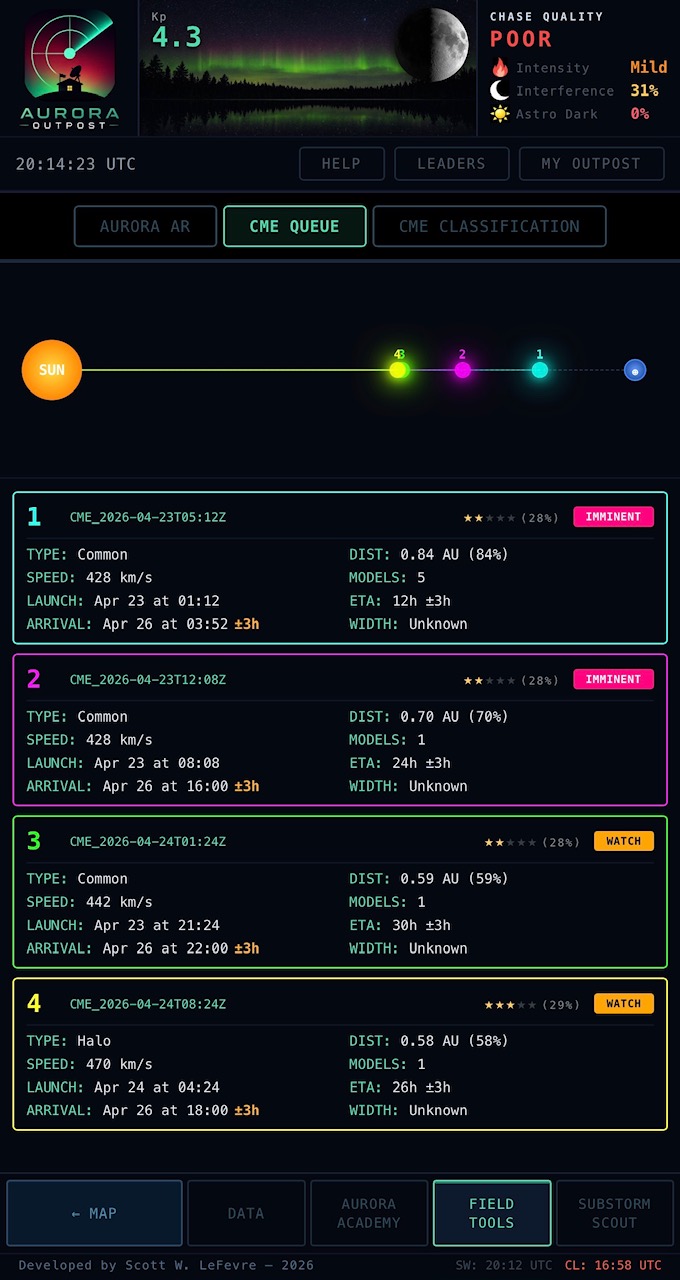
Its own footer button. Four tabs: CME QUEUE (deep-dive on every inbound), CME CLASSIFICATION (live flux-rope analysis), WSA-ENLIL (NOAA's deterministic forecast animation embedded directly), and HUXt (University of Reading SPATE group's ensemble forecast image + animation, also embedded). Both ENLIL and HUXt are also mirrored under the DATA tab’s SOLAR WIND dropdown so you don’t have to switch contexts to compare with live L1.
The state machine tracks every Earth-directed CME in the CCMC Scoreboard through a seven-stage lifecycle: QUIET → WATCH → INBOUND → IMMINENT → ARRIVED → STORM_ACTIVE → SUBSIDING. Each transition is driven by physics: WATCH on scoreboard entry, INBOUND when STEREO-A picks up the upstream signal, IMMINENT in the final hours, ARRIVED on confirmed L1 ejecta detection (Bt elevation + sustained southward Bz + speed signature, with thresholds tiered by CME speed so slow CMEs aren't missed), STORM_ACTIVE once the storm phase develops, SUBSIDING as it fades. Cards show NASA DONKI source region, half-angle, modeled arrival window, ENLIL/HUXt model count, and historical context.
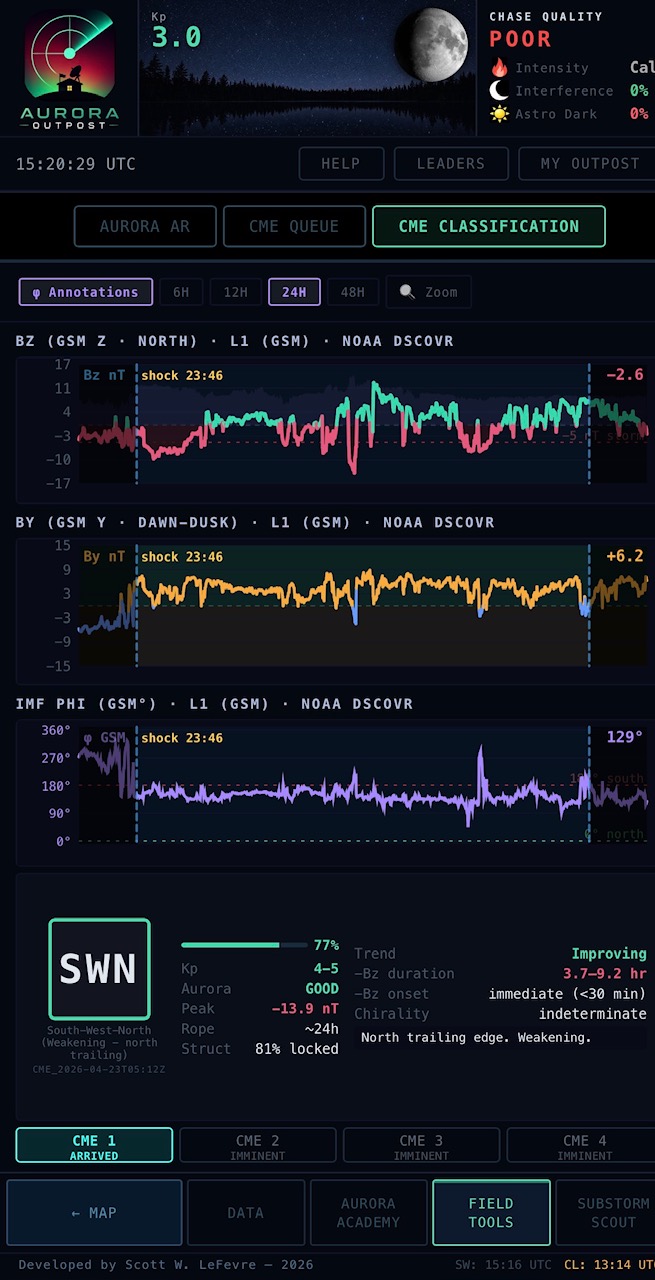
The auto-classifier reads the magnetic structure of each arriving CME — leading-edge Bz signature, sheath turbulence, flux-rope chirality, and Bothmer-Schwenn typing across SEN, SWN, ESW, WSE, NES, NWS, ENW, WNE. It tells you whether to expect leading-south Bz right now, trailing-south Bz hours from now, or no help at all from this particular pulse. Tentative classifications surface immediately at low confidence and sharpen as the rope passes through L1, so you're not staring at "TBD" for an hour while the storm builds. Critical because most CMEs deliver the bulk of their southward Bz hours after first impact — you need to know if you should leave now or wait until 2 a.m.
HUXt vs ENLIL. Both run from the same upstream inputs (WSA + DONKI / ACME). ENLIL is single-run / deterministic — one best-estimate trajectory through the next 5 days. HUXt runs a 500-member ensemble and produces probability bounds on arrival time, arrival speed, and 5-day solar-wind speed at Earth. Together they bracket the forecast: deterministic best estimate plus uncertainty envelope, both embedded in-app so you don't have to pop out to a third site.
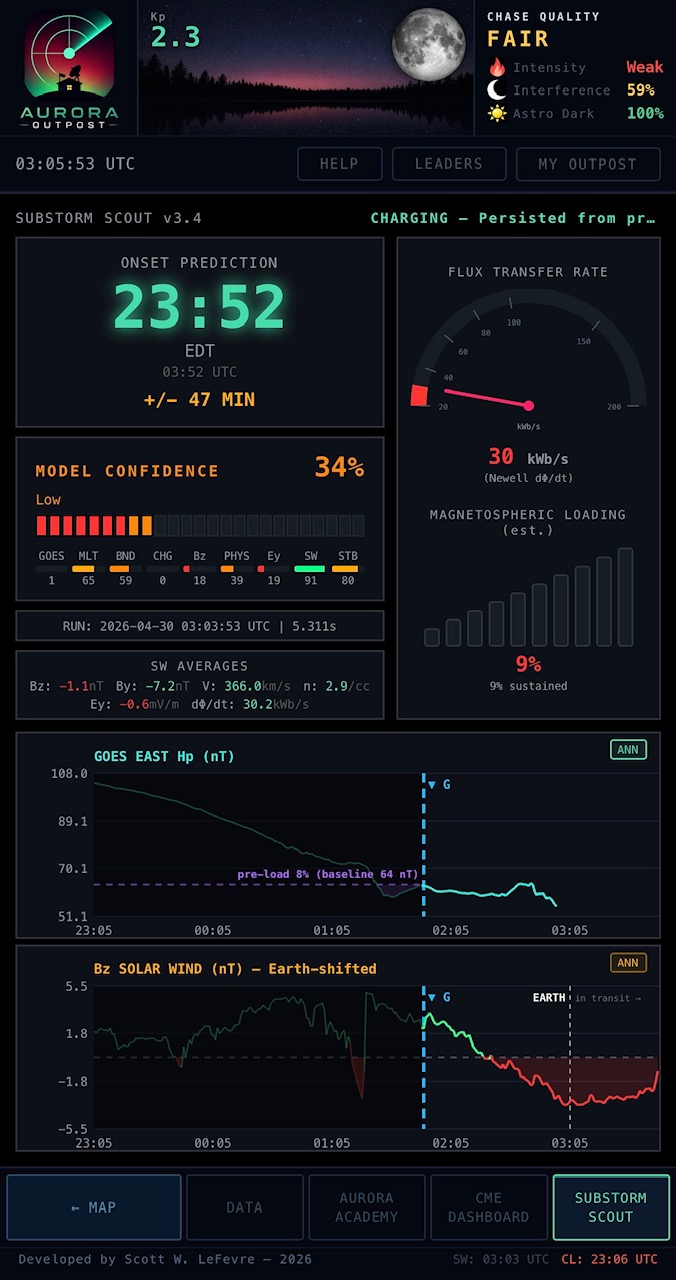
A custom substorm prediction timing model unique to Aurora Outpost. Substorm Scout aims to give the longest-range timing predictions possible — starting from the first moments magnetotail charging is observed in live, non-lagging data feeds. Using a solar-wind-driving regime-based blend of physical and statistical calculations, it gives chasers the best and most honest window of when to be out in the field — cameras ready!
Has its own dedicated tab in the app footer. Shows the probability the substorm will fire in the next N minutes, charging state of the magnetotail (early / building / loaded / overdue), confidence level (low / medium / high), and the underlying signal driving the prediction so you know why the model thinks tonight is the night. Configurable alerts trigger when probability crosses your chosen threshold.
Runs every 2 minutes, 24/7 — so it catches events that fire while you’re asleep or not actively watching the data. Trained and cross-validated on 4,297 substorm events from the SOPHIE catalog (2016–2022). Substorms have intrinsic timing variability no model or human can predict past — treat the output as a strong signal, not a guarantee.
Designed, trained, and shipped solo.
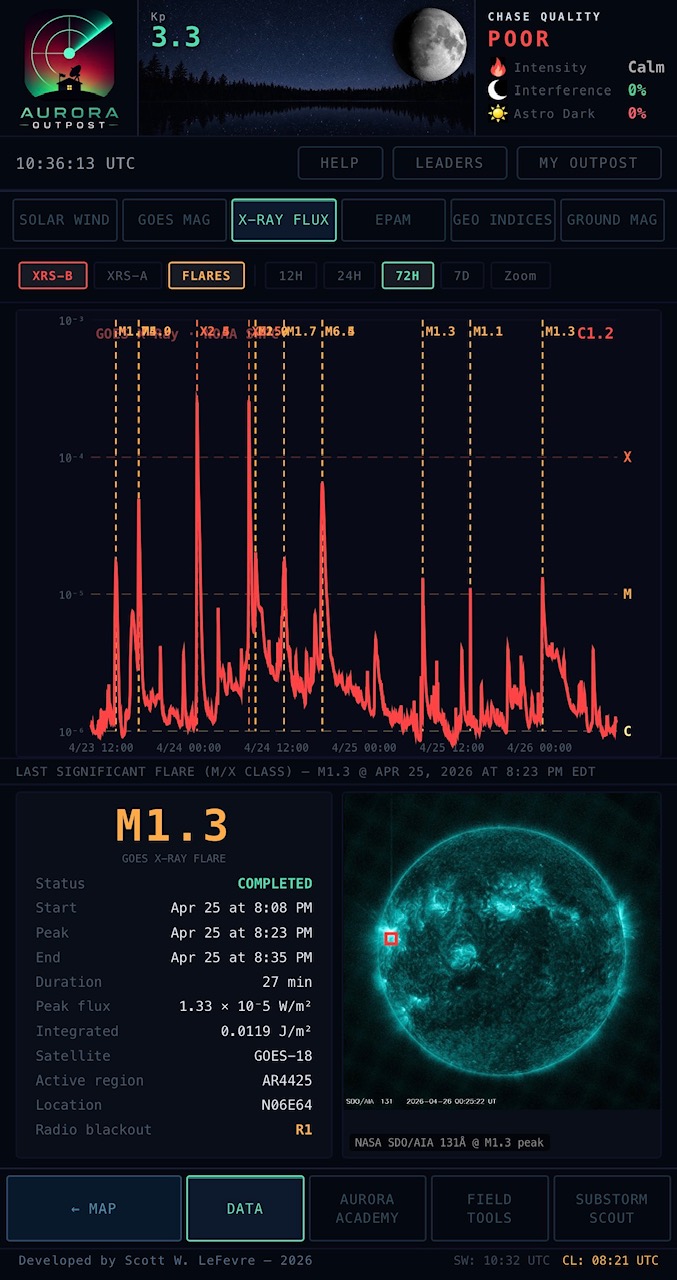
Live X-ray flux from GOES primary + secondary satellites, with NOAA flare classification (A / B / C / M / X) and real-time alerts on M-class and above. Each significant flare gets a full card with peak time, duration, source active region (e.g., AR4419), heliographic location (e.g., N17W66), and a SDO 131Å solar disk image with a red bounding box on the active region that fired.
Toggle backward / forward through the last 7 days of M and X-class flares with the OLDER / NEWER buttons — each step swaps in the flare's data card and its SDO image with the source-region box, and highlights its dashed line on the X-ray flux plot above so you can see exactly which spike you're inspecting. Default view always lands on the most recent significant flare.
Critical context for whether a CME might follow — west-limb flares can fling material toward Earth even without obvious dimming; east-limb flares are usually duds for chasers. The bounding box tells you where to look in the SDO browse archives if you want to dig deeper.
SKY CONDITIONS
 WHAT THE APP HELPS YOU FIND
High-frequency cloud cover tiles regenerated every hour: HRRR for the continental US (3km grid, hourly), OpenMeteo for everywhere else. The freshest forecast is always loaded when you open the map.
Time slider lets you scrub forward up to 18 hours to see how a clearing window will or won't materialize at your spot. Color-coded so you can read the map at a glance without squinting at percentages. Combined with the OVATION oval, it instantly answers "where will it both be aurora-visible AND clear tonight?"
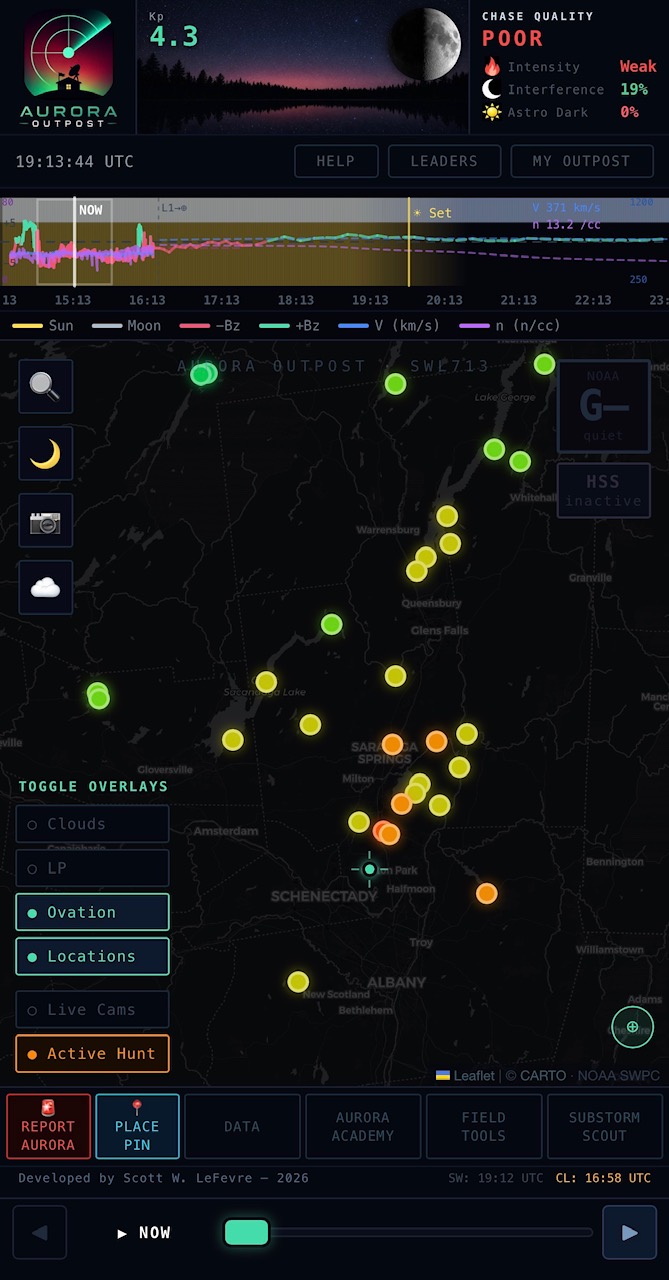
Live OVATION auroral-precipitation overlay showing where the lights are predicted to be over the next 30 minutes. Color-coded by intensity (precipitation flux in mW/m²). Reads the dynamic boundary, not just the static 60° geomagnetic latitude line that most chase tools rely on.
Pair with the cloud layer for an instant "where can I actually see aurora AND have clear skies tonight" map. Toggle layers independently from the map controls panel; preferences persist across sessions.
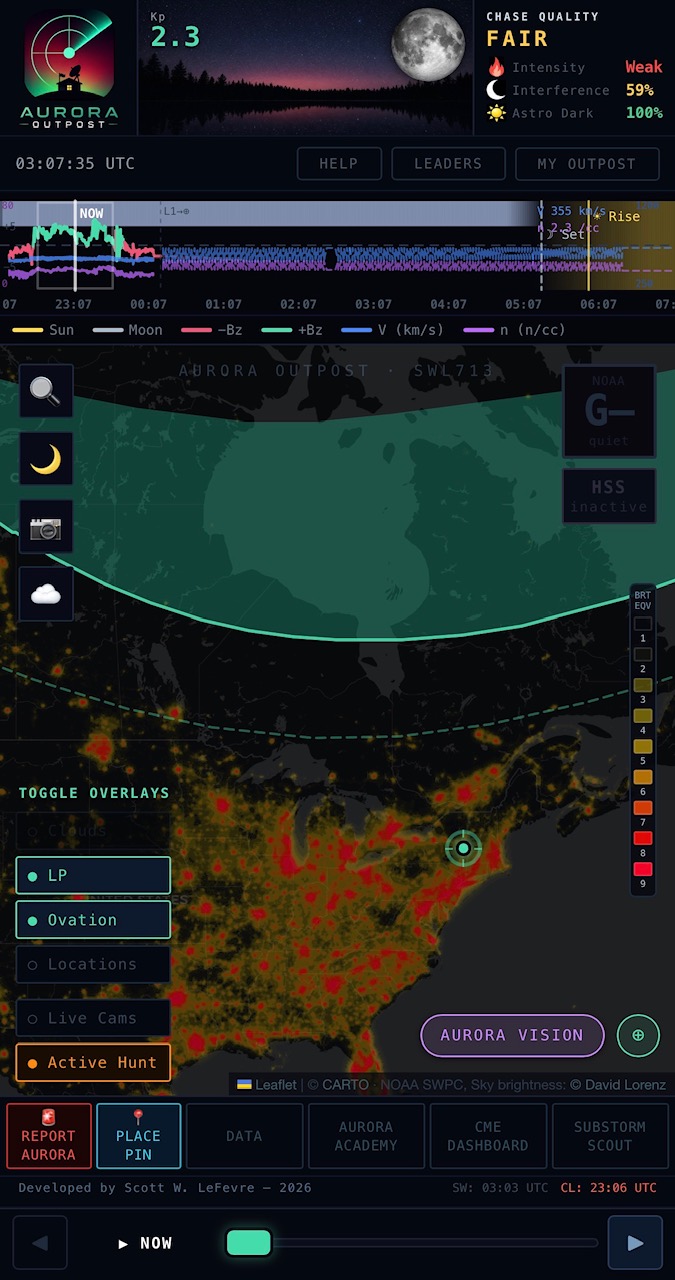
Full-resolution Bortle scale overlay (1 = pristine dark / 9 = inner-city) so you can see at a glance whether a spot is dark enough for naked-eye aurora versus photo-only conditions. Built from VIIRS satellite radiance data.
Tap any point on the map to read the local Bortle class. Saved locations automatically pick up their bortle rating so it shows on your collection cards. Critical for chase planning at mid-latitudes where the difference between bortle 4 and bortle 7 can mean the difference between catching a faint pillar and seeing nothing.
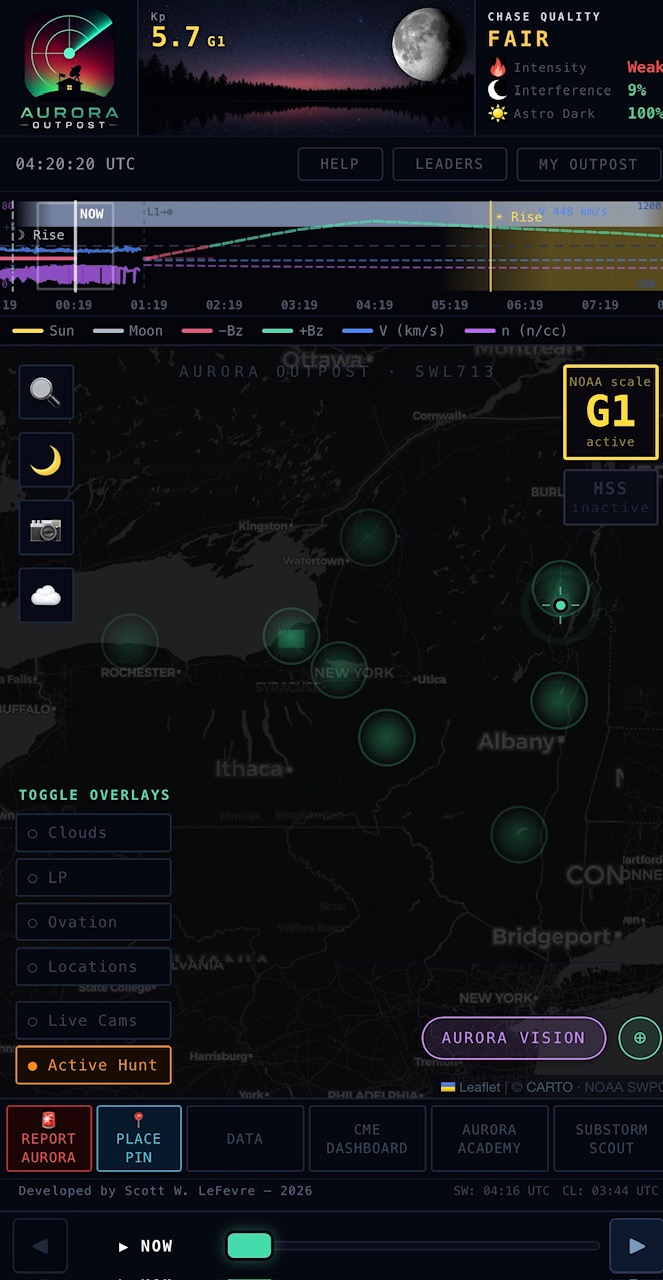
A one-tap chase mode that fuses the cloud, light-pollution, and moon-glow layers into a single “tonight’s best viewing spots” map. Drop an anchor at your starting location, set a search radius, and saved spots within that radius re-color by combined sky quality — cloud cover at the forecast hour weighted against bortle class and moon illumination. Spots outside the radius dim back so the eye locks onto the actually-reachable options.
Built for the “I want to chase tonight, where should I drive?” question. The radius slider scales from local-only to a multi-state hunt; the time slider lets you scrub forward into the cloud forecast and watch which spots open up as a clearing window passes through.
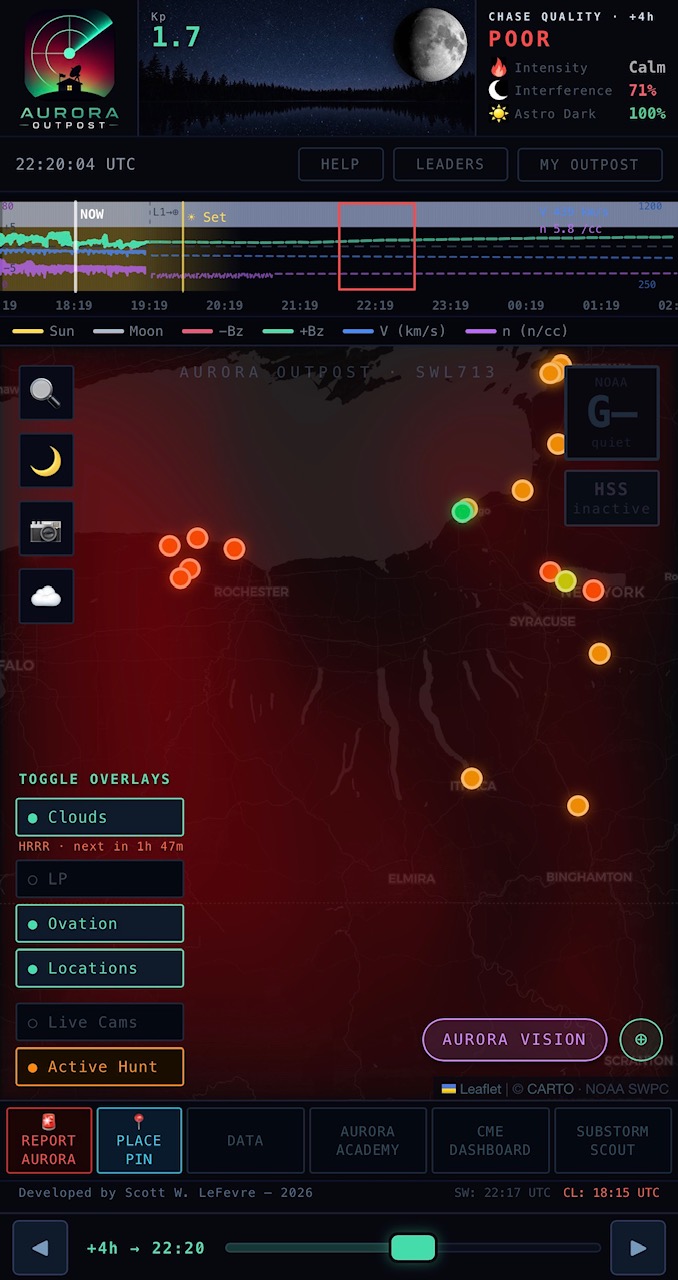
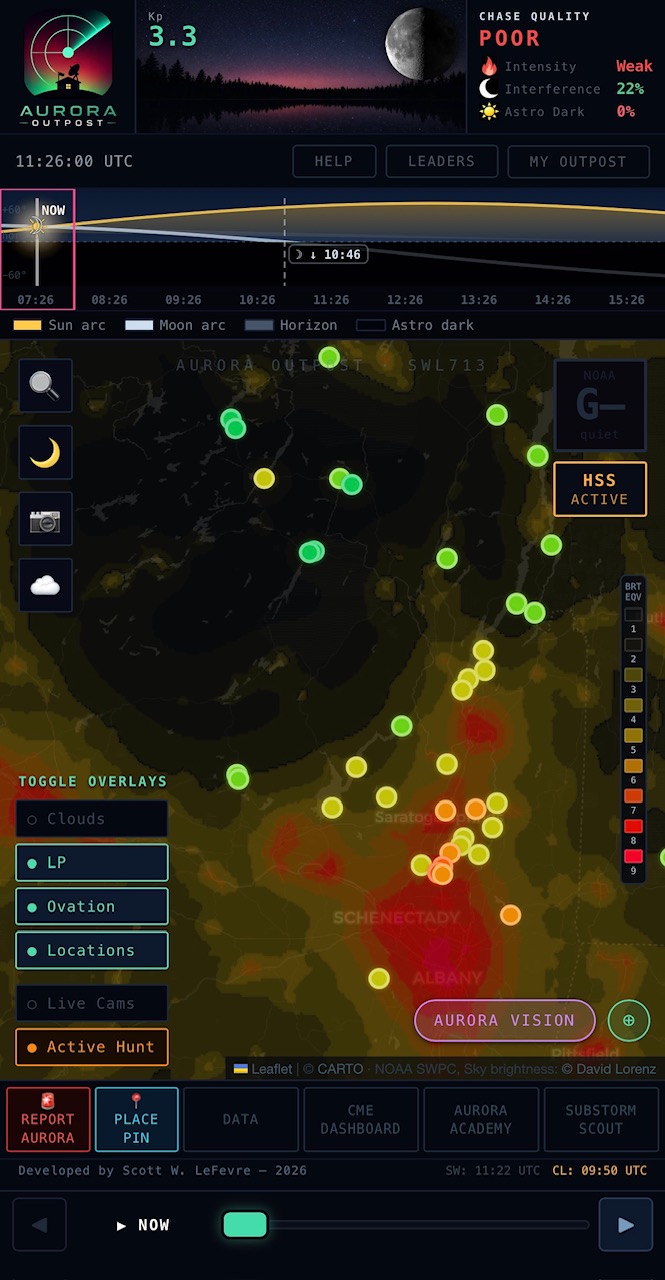
An always-on strip across the top of the map that answers two questions every chaser asks first: is it dark yet, and is the moon in the way? The horizon line splits the strip in half — the sun and moon ride above it as smooth arcs when they’re up and dip below it when they’re not.
The background sky color follows real sun depression in real time: daylight blue through civil twilight (orange/pink horizon glow) through nautical and astronomical twilight to full astro dark. Stars sprinkle in once the sun drops below civil and brighten through nautical into full astro dark. The moon arc’s thickness and brightness scale with illumination — a new moon barely shows; a full moon is unmistakable. Sun and moon glyphs ride along their respective arcs at the currently-selected forecast hour, so as you drag the time slider the symbols slide along the curves and you can see at a glance whether the moon will still be up at midnight or already below the horizon.
Rise and set crossings are marked with vertical dashed lines and small labeled pills (“☀ ↓ 19:23”) so you can read precise times without doing math. Computed live from your actual coordinates — not a NYC default — so the times are right whether you’re in Fairbanks or Adelaide.
FIELD TOOLS
Hold your phone up to the night sky in landscape mode for an augmented-reality overlay on your camera view. Uses your compass, GPS, and the live OVATION oval to render: predicted oval position as a glowing arc across the sky, compass markings with cardinal directions, magnetic-midnight countdown (substorm peak window), live Bz / solar-wind speed / Kp readouts floating in your field of view, and a camera exposure coach suggesting ISO + shutter speed for current sky conditions.
Shows you where the aurora should be even when haze, moonlight, or city glow is washing out the actual signal. Reporting a sighting from this view tags it with your exact heading + tilt for accurate community ground-truth.
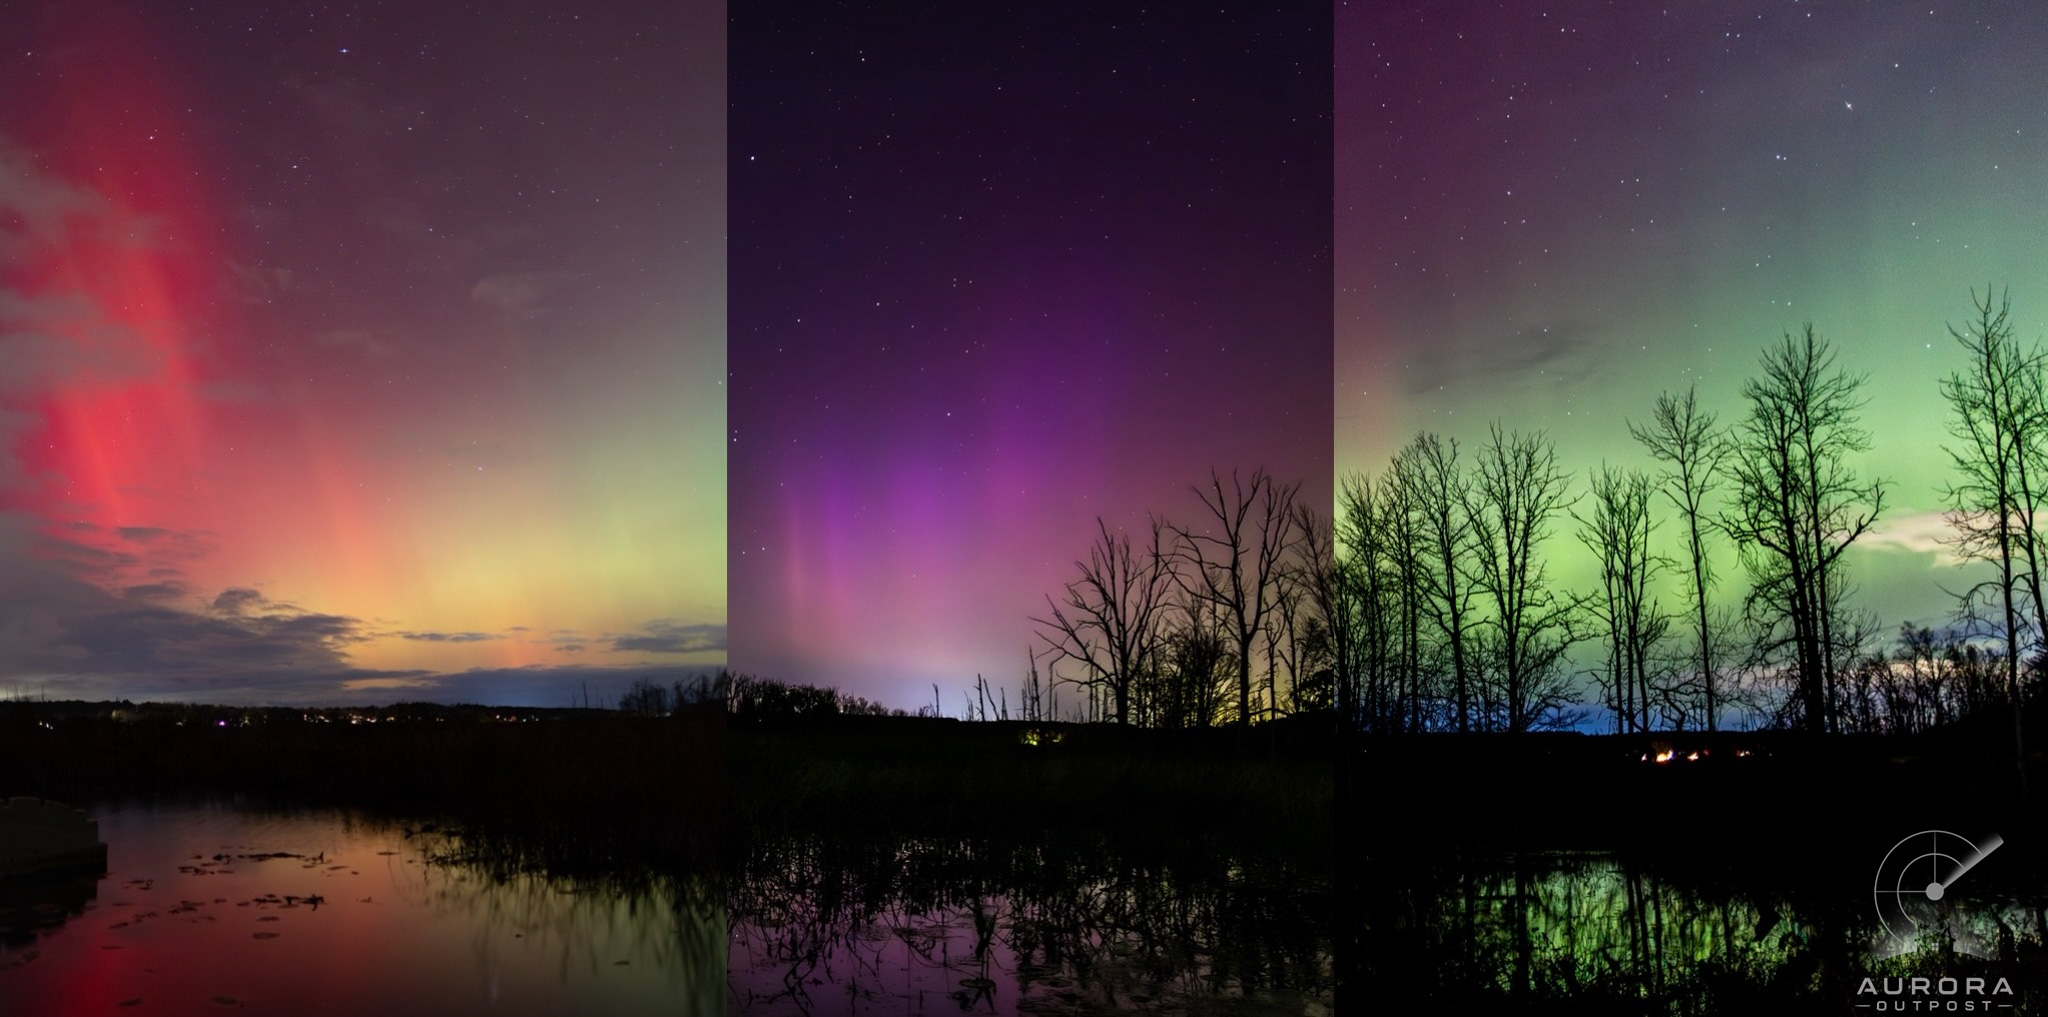 SAME WETLAND · THREE SEPARATE NIGHTS · THREE DIFFERENT SHOWS
Save dark-sky spots with photos, notes, GPS coordinates, bortle class, and live cloud cover all baked into one card. Place pins directly on the map or import from your existing chase spots. Each location automatically shows current weather, sky transparency, and distance from your home.
Group locations into collections (“summer chase spots”, “north-facing horizon”, “quick drives”). Private by default. Share specific collections with friends; list individual spots publicly if you want the community to use them. Drop a sighting report from any saved location with one tap. The payoff: a single good location pays back over and over.
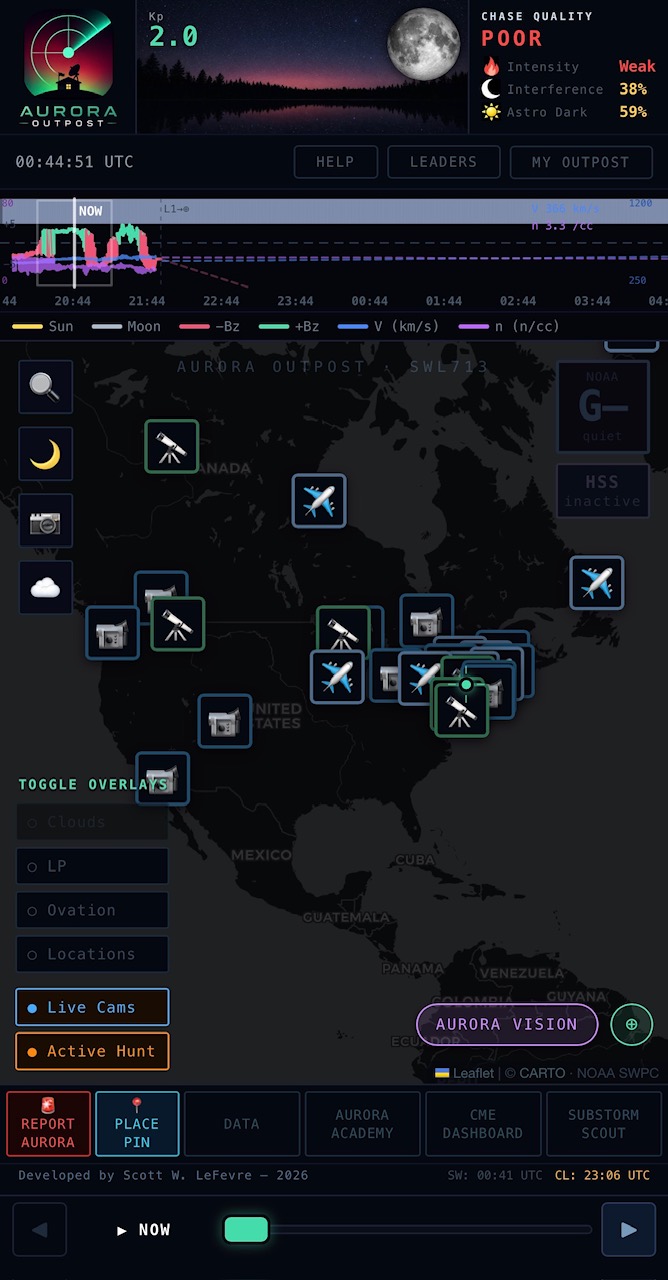
Three classes of camera markers across the region: 📹 general cameras (community-submitted webcams), 🔭 all-sky cameras (pointing straight up; great for verifying actual aurora visibility), and ✈ FAA airport weather cams (high-quality, regularly maintained, surprisingly good for sky conditions).
Tap any marker for a live snapshot preview + a link to the full stream. Useful for verifying clouds and aurora visibility hundreds of miles ahead of your route before committing to the drive. Updated regularly as new community-submitted cams come in.
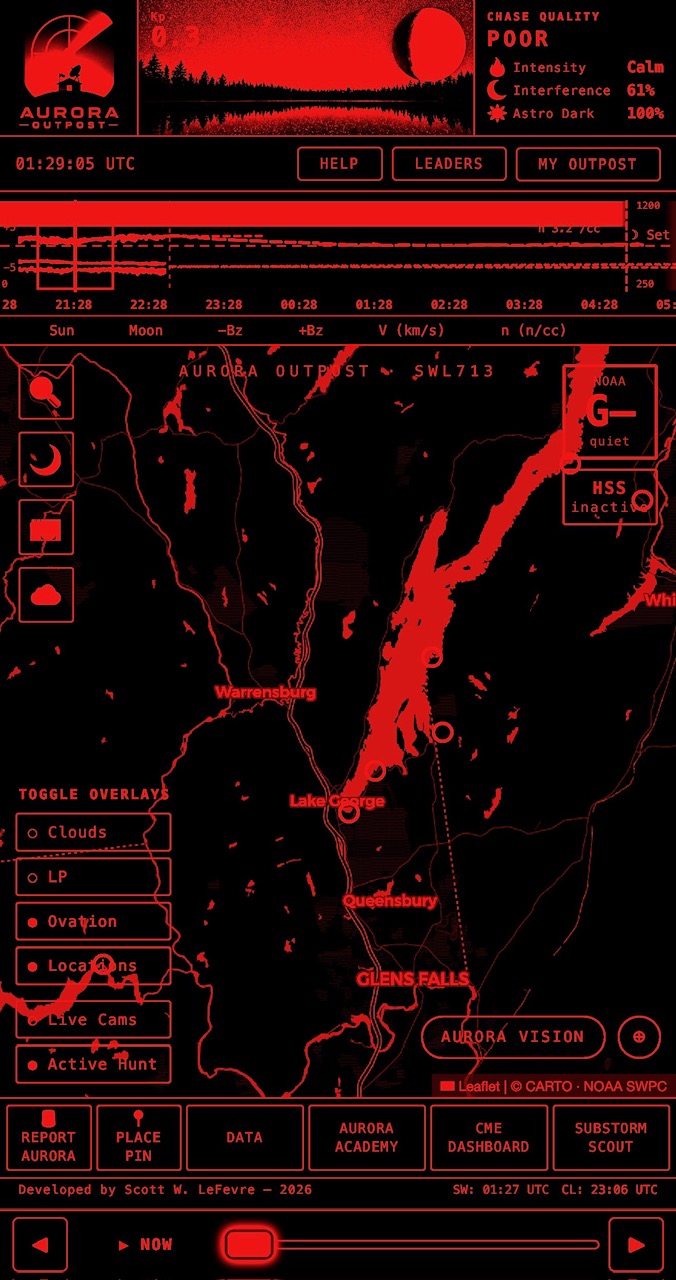
One-tap deep-red UI that preserves dark adaptation in the field. Built with a CSS filter chain (grayscale → sepia → hue-rotate → saturate) so every surface in the app — map tiles, dashboards, photos, sighting cards, your own avatar — renders in the same uniform crimson.
No mismatch between “night mode pages” and “leaked white pages.” Tap once to enable, tap once to disable. Setting persists across the session so you don’t blow your night vision checking conditions on the drive out.
COMMUNITY
Real chasers reporting in from the field, with intensity ratings (eye / camera / pillars / corona / overhead), photos, approximate location, and current sky conditions. See what’s actually happening in the sky right now, not just what the forecast model says.
Reports are tied to where you actually are. The app captures your location via GPS (with an IP-based fallback when GPS is off), so badges and stats reflect a real chase — not a wishful map tap. Locations are rounded to ~1 km before being shared, so your exact spot stays private even though the latitude band, region, and Bortle score are accurate.
Community honesty layer: any signed-in chaser can 🚩 flag a sighting they think is suspect (with optional reason text). Flags are invisible to non-admins — the sighting still looks normal to everyone else — but admins see flagged sighting rings render in a red/pink glow on the map and a dedicated FLAGGED SIGHTINGS review queue with VIEW / DISMISS / DELETE actions. If a flagged sighting is deleted, any badges earned through it are automatically revoked. Community spotting + admin review keeps the trophy case clean.
Filter by region, intensity threshold, recency (last hour / 4 hours / night), or friends-only. Tap any sighting to see the full report and the chaser’s public profile.
Send friend requests to other chasers from their public profile. Once accepted: share location collections (your hand-picked spots) with specific friends, get a push when a friend files a sighting within range, and see them on the map during active nights. Built for chase groups who want to coordinate in real time without a million WhatsApp messages.
All opt-in. You control who sees what; nothing about your locations or activity is visible until you explicitly share it.
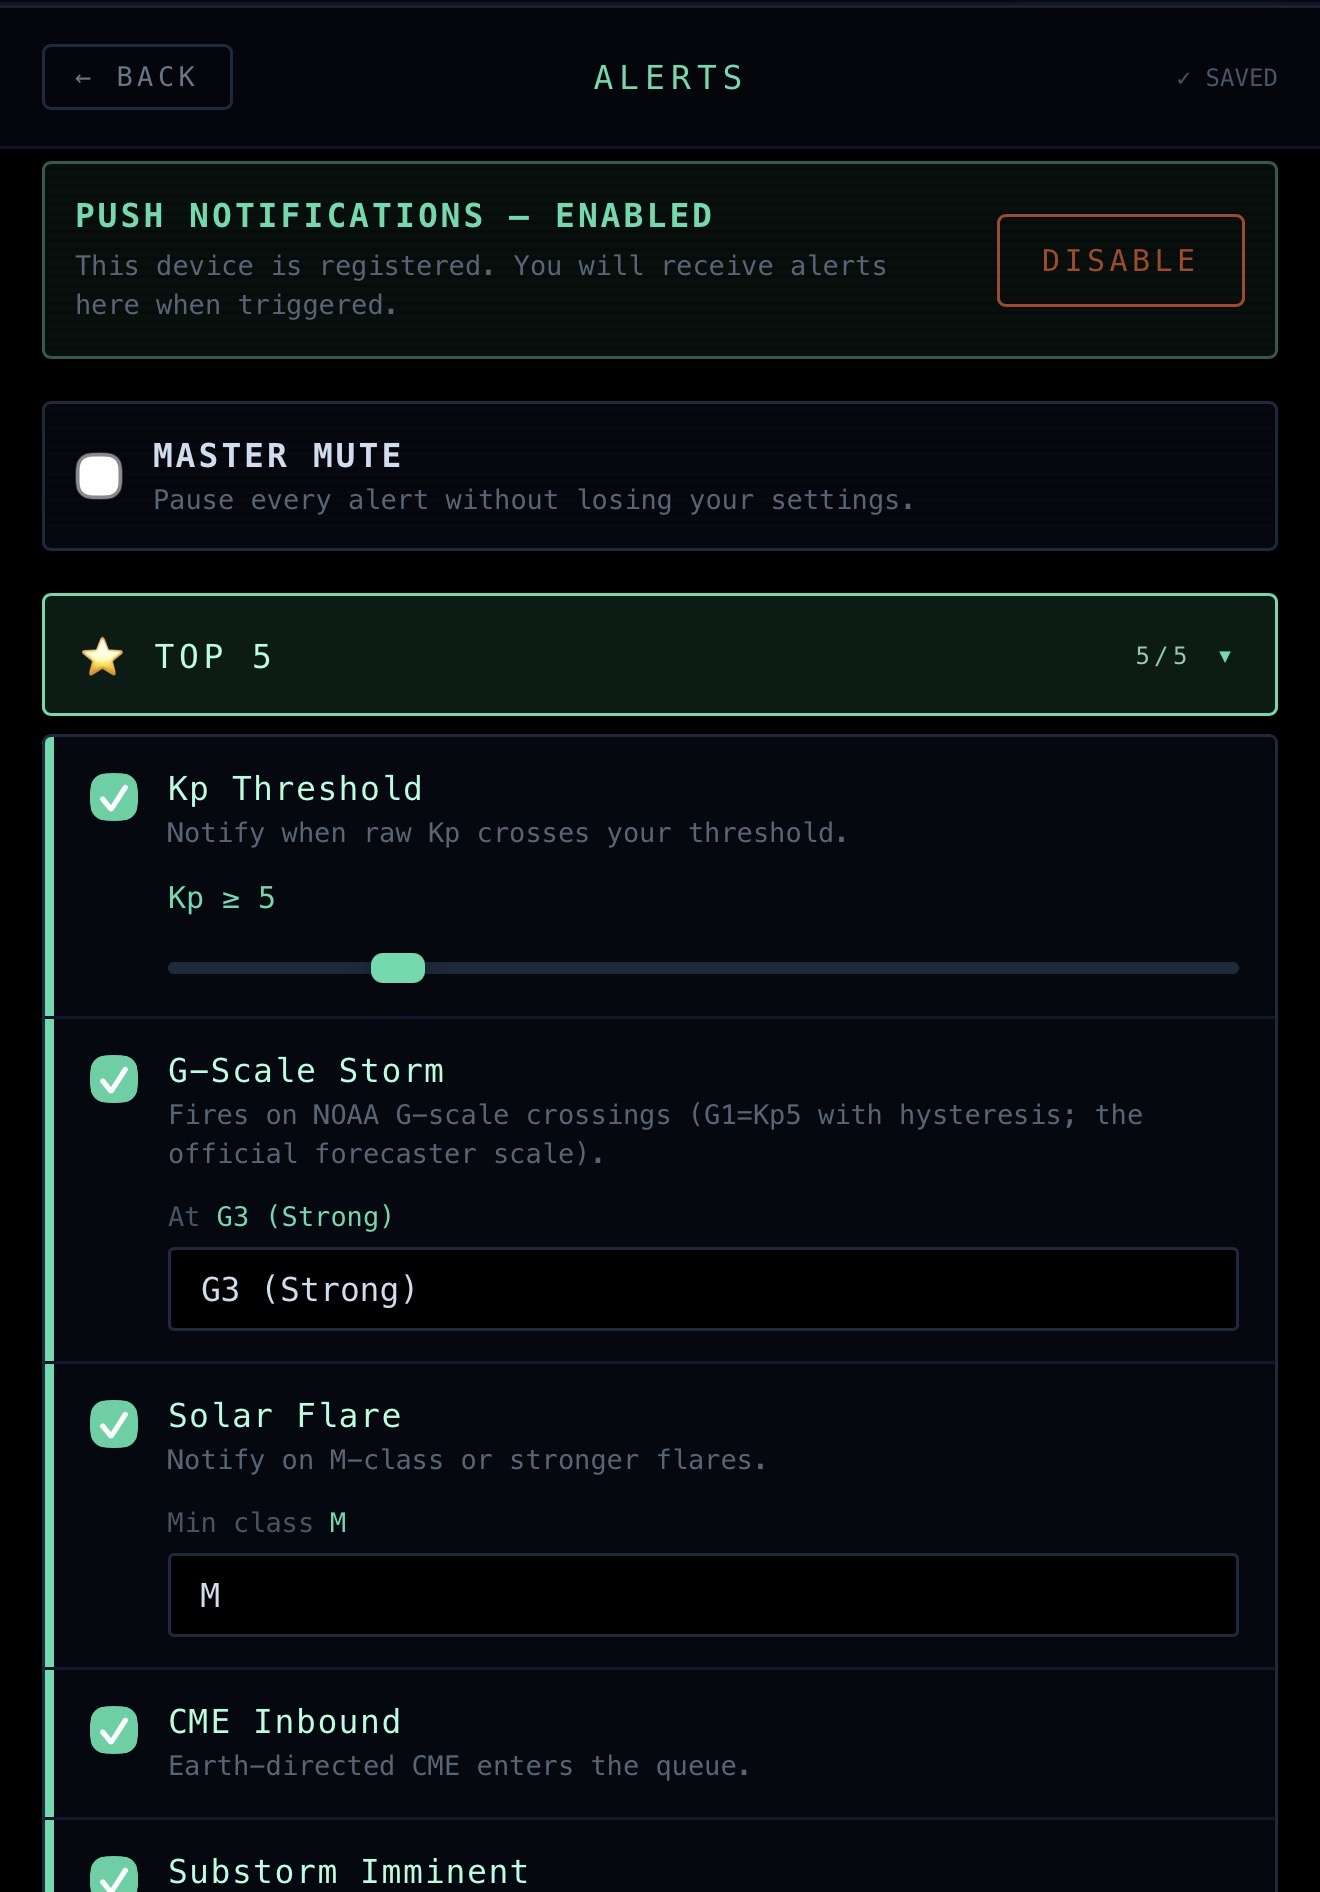
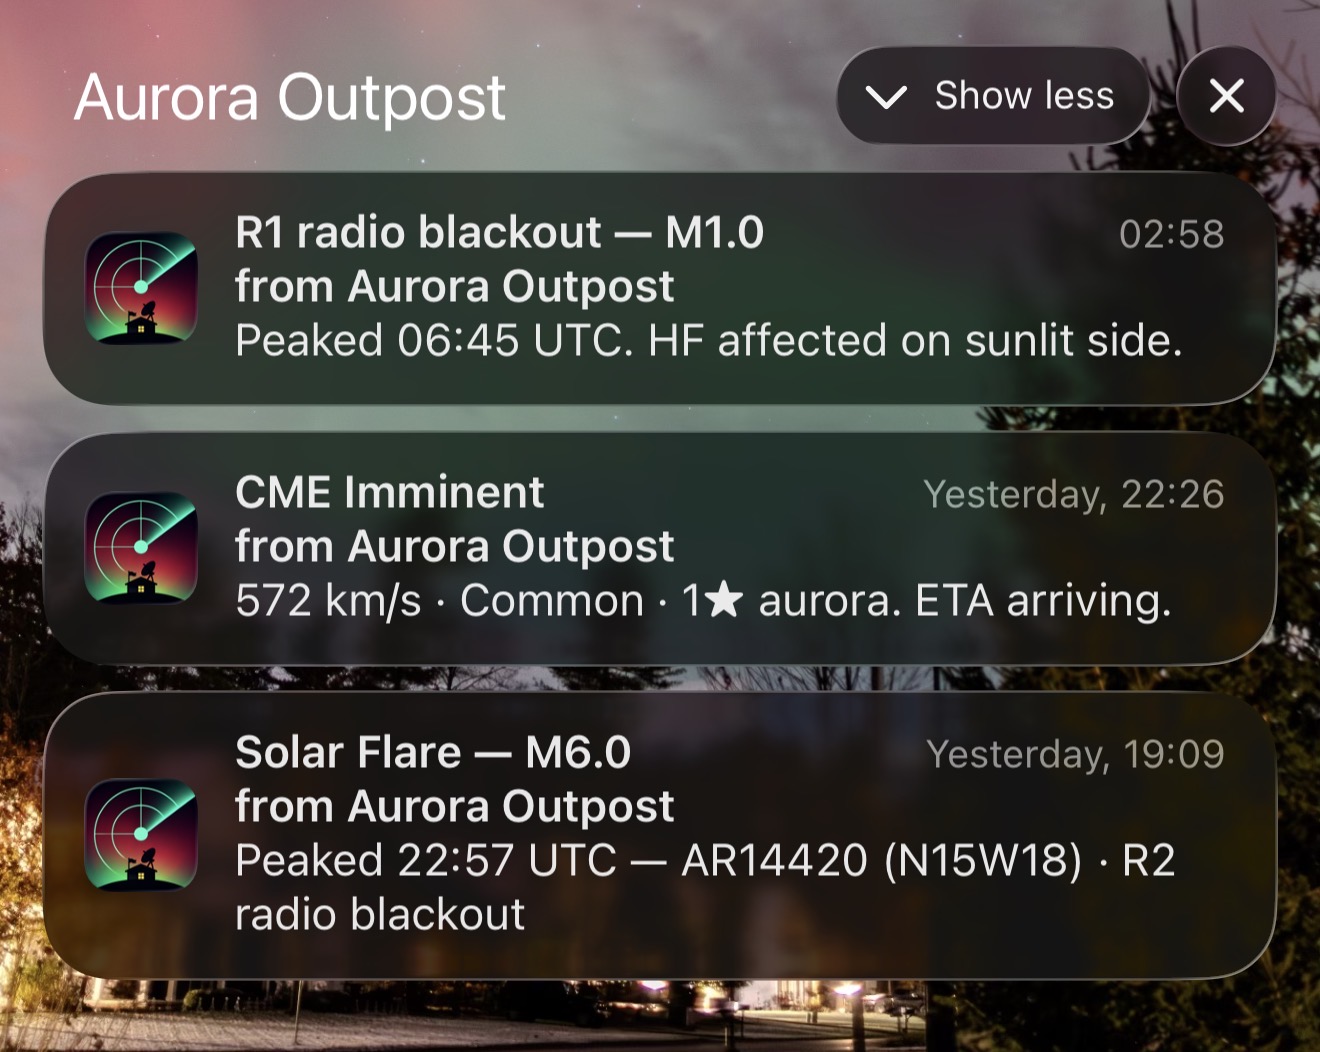
32 configurable push notification types across forecasting (geomagnetic storm at your Kp threshold, G-scale crossing, solar flare M+ / X+, CME inbound, CME shock confirmed, magnetic-cloud confirmed at L1 — the “it just hit” ping distinct from prediction, compound-CME warning when two arrivals overlap, Bz southward, solar wind speed surge, sudden L1 shock, density spike, HSS arrival, radio blackout, coronal-hole-Earth-facing 3-5 day heads-up, STEREO-A Bz early warning for 30-60 min lead time over L1, flare-with-CME chain, severe storm G4+, Carrington-class extreme), aurora visibility (OVATION overhead, OVATION viewline reached your latitude, oval-at-my-latitude via HRV magnetometer, Aurora Australis at NZ/AU latitudes via EYWM magnetometer, extreme low-latitude storm, Substorm Scout imminent), nerd-tier (CPCP saturated, hemispheric power, STA proton event), and briefings & community (evening aurora briefing 30 min before sunset, sighting nearby, friend sighting, friend request received, badge unlocked).
Wake me at Kp 6+. Ping me when Bz drops below -10 nT. Tell me the moment a CME actually arrives, not just when it’s predicted to. Heads-up me three days out when a coronal hole crosses central meridian. Alert me when a friend within 200 mi reports a sighting. Don’t bother me before sunset on weeknights. Each alert has its own threshold slider, cooldown, and quiet-hours rule. Master mute toggle for travel days. Configure once, get the right pings only.
MY OUTPOST
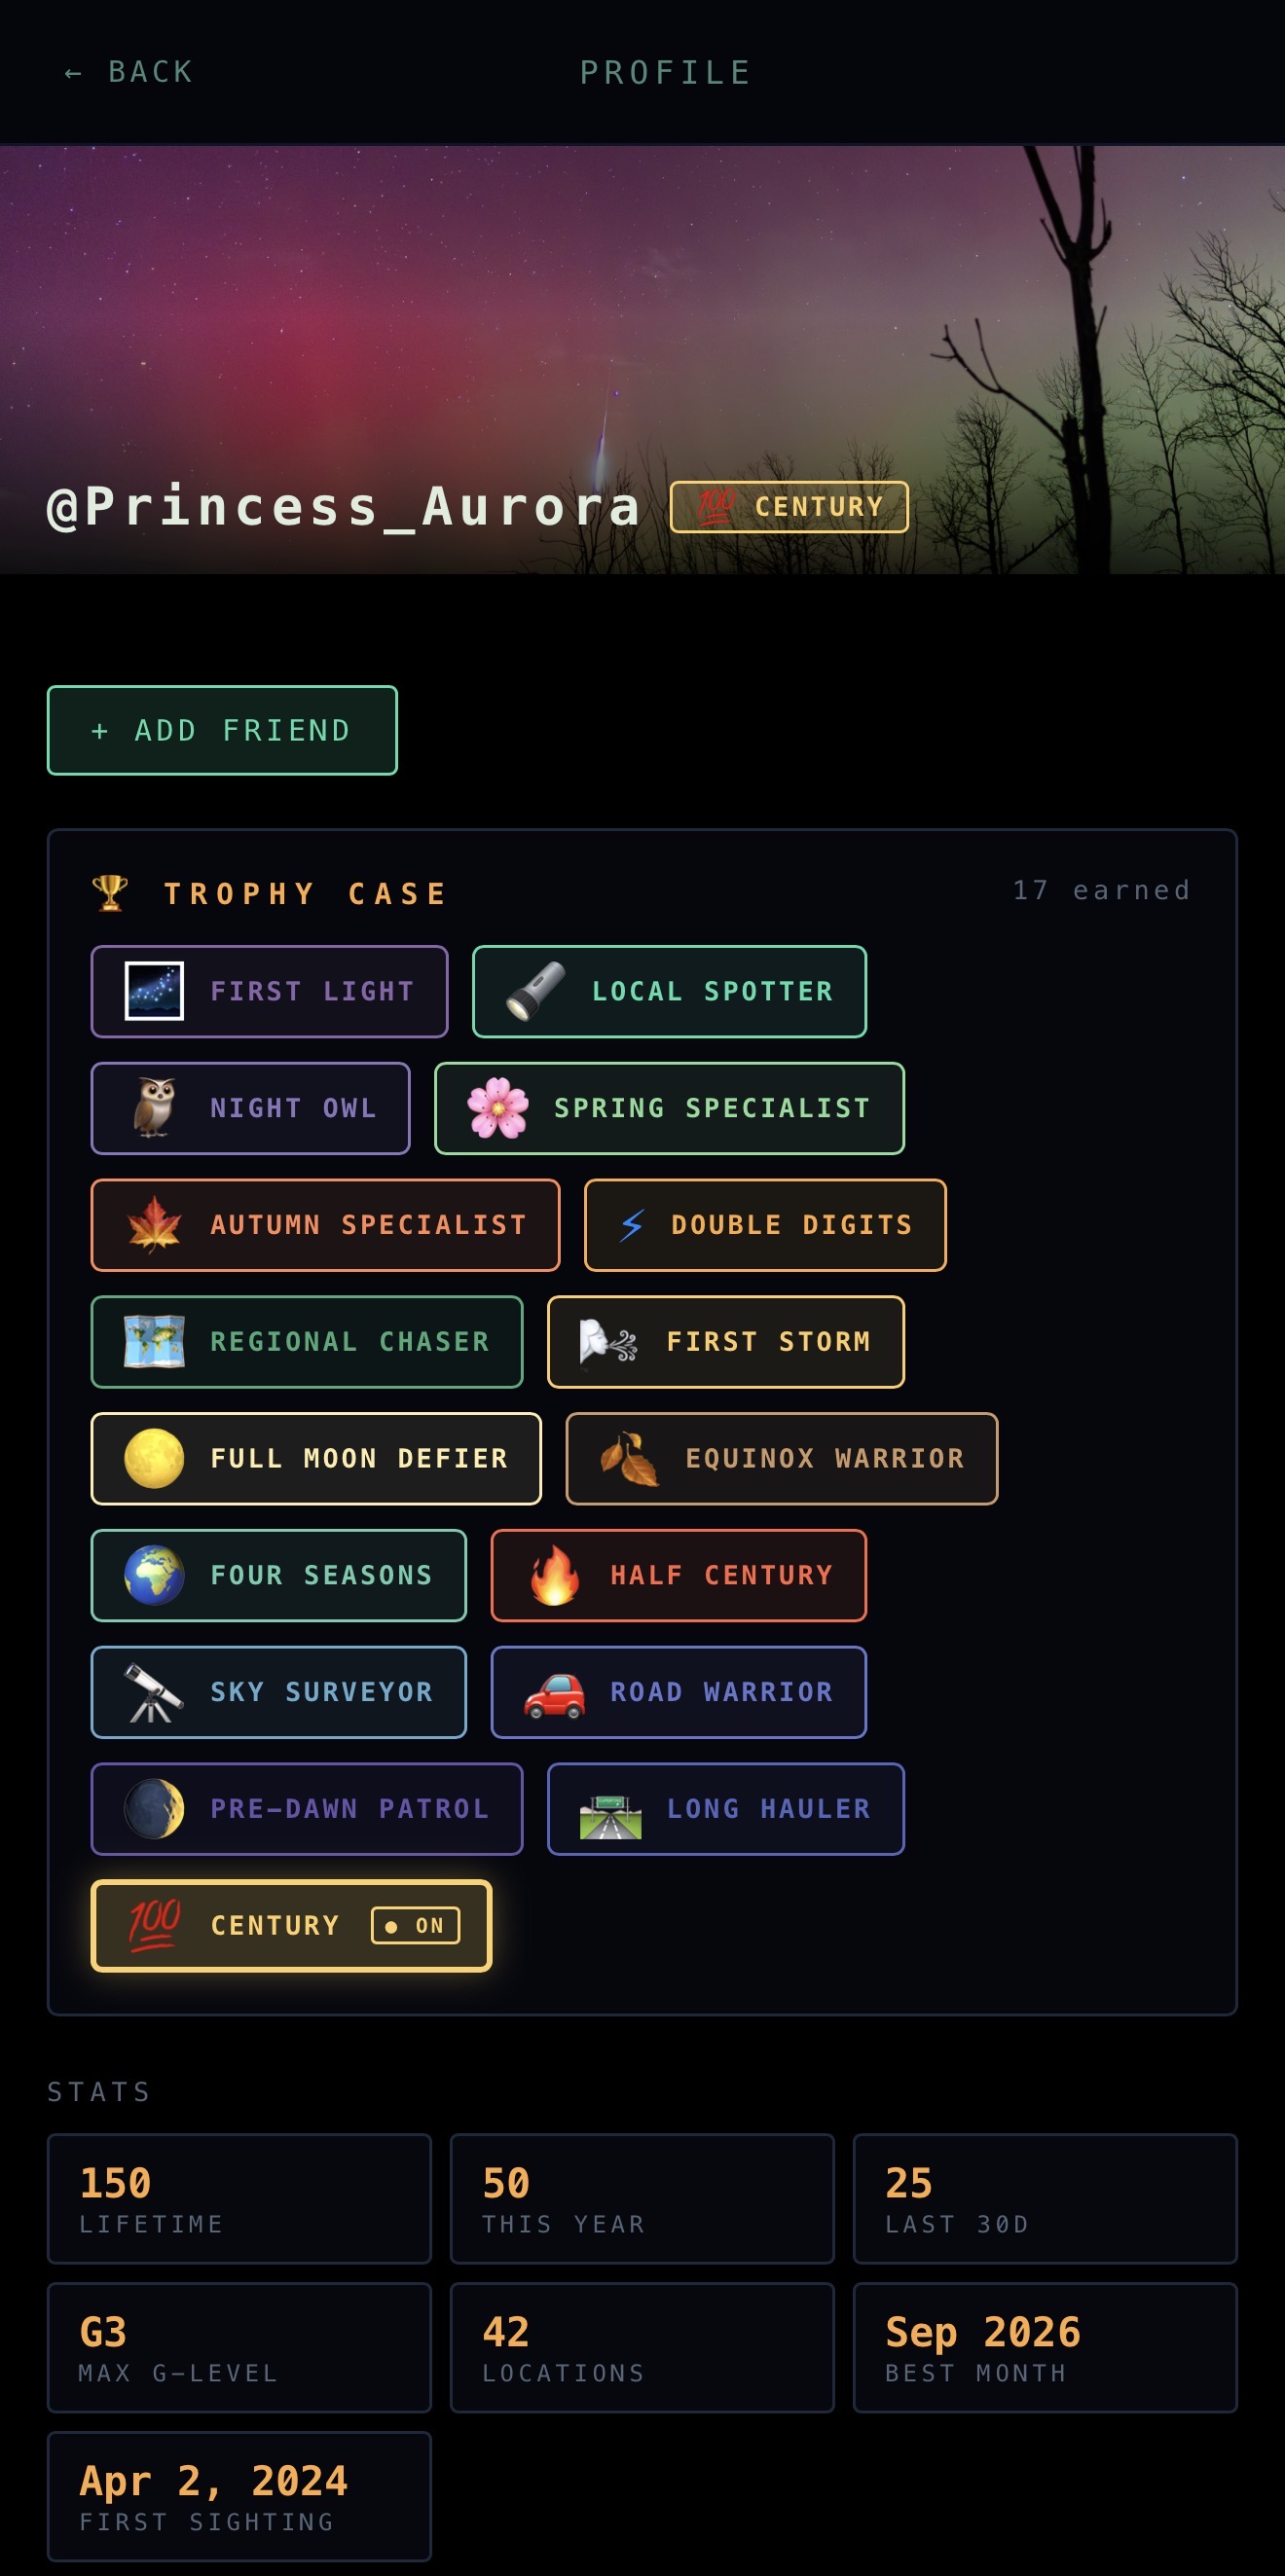
Your face to the rest of the chase community. Hero banner with your favorite aurora photo, display name, the chip-style displayed badge next to your @username, your Trophy Case rendered as a single-row showcase any visiting chaser can tap to see what each badge represents, plus stats tiles at the bottom (lifetime, this year, last 30d, max G-level, etc.).
Customizable from My Outpost → PROFILE: avatar banner (drop your favorite aurora photo), display name, real name with show/hide toggle, pronouns, home region (broad band like “Mid-Atlantic” or “Pacific Northwest”), home state or Canadian province (dropdown with US states + Canadian provinces, abbreviation in option labels for quick scanning), chasing-since year, equipment / setup, bio, Instagram handle, and personal website.
Granular display controls on every public-facing field. Show or hide region. Show or hide state/province. Toggles save independently — reveal one, both, or neither in the 📍 line under your username (and in the user-search dropdown). Same per-field control on real name. Stats tiles on your profile each have their own show/hide toggle so you can pick which records you want public.
Public / Private profile with a "friends can see my private profile" override (default ON — flip to OFF for me-only mode). Private profiles still don’t appear in user search; friends just get a side-channel view. 45-day cooldown on username changes after your first free swap.
Group your saved spots into collections — themed bundles like “summer chase spots”, “north-facing horizon”, “quick drives from town”, or “dark-sky weekend trips.” Each collection holds any number of locations, and a single location can belong to multiple collections.
Private by default. Locations don’t show on the public map until you decide. Three sharing modes per collection: private (only you), shared with friends (specific accepted friends — the spots show in their map but no one else’s), and public (listed in the discovery directory for any chaser to find and join). You can also flip individual locations to public independently of their collection — useful for that one safe roadside pull-off you don’t mind broadcasting while keeping your home spot private.
Joining other chasers’ collections works the same way: browse public collections in the directory, hit JOIN, and those spots appear on your map alongside your own. Leave any time. When the owner adds, removes, or edits a location, members get the update immediately — the collection is the source of truth, not your local copy.
Search by username from the Friends inbox in My Outpost — type a name, see matching public profiles, tap one to view their stats and add them as a friend. Requests need acceptance; pending requests show up in the recipient’s inbox with ACCEPT / DENY buttons. Mutual friendship is required for shared collections to flow through.
Once friends, you can: share specific collections with them, see their sighting reports tagged in your feed (with optional “friend sighting nearby” push alerts), and view their public profile + chase stats. Sighting privacy still applies regardless of friendship — locations are rounded to ~1 km in any sharing context, so no one’s home spot leaks even to friends.
Removing a friend is a single button-tap with confirmation. No hard feelings, no permanent record. Either side can re-request later if circumstances change. Built for chase groups who want to coordinate in real time without a hundred WhatsApp threads.
Every sighting you log feeds an evolving stats page that shows your aurora-chasing history with a level of detail no other app surfaces. Until you’ve filed your first sighting, the page shows a friendly “404 — AURORA NOT FOUND” empty state pointing you to the report button.
Totals: lifetime sightings, this year, last 30 days, last 7 days, nights observed (unique nights you caught something), unique locations chased from. Records: max G-level storm caught, average Kp across all your sightings, strongest southward Bz at a sighting, average solar wind speed and density when you’ve been catching the lights, best month, best year, distant cells (~70 mi grid representing the geographic spread of your chases). Milestones: first sighting on file, latest sighting on file.
Plus interactive bar charts: by year, by month (last 24 months), by hour of night in your local time (when do you actually catch shows), by intensity rating, and by observation tags. Patterns emerge over time — you start to see your own chase rhythm and the conditions that work for your latitude and horizon.
Aurora Outpost gamifies chase reporting in a way that gives back to the community: every sighting you log is data the rest of the network uses — ground-truth for the forecast, hits on the live map, references for chasers asking “is anyone seeing it right now?”. The badge system rewards that contribution while turning chase history into something visible and proud.
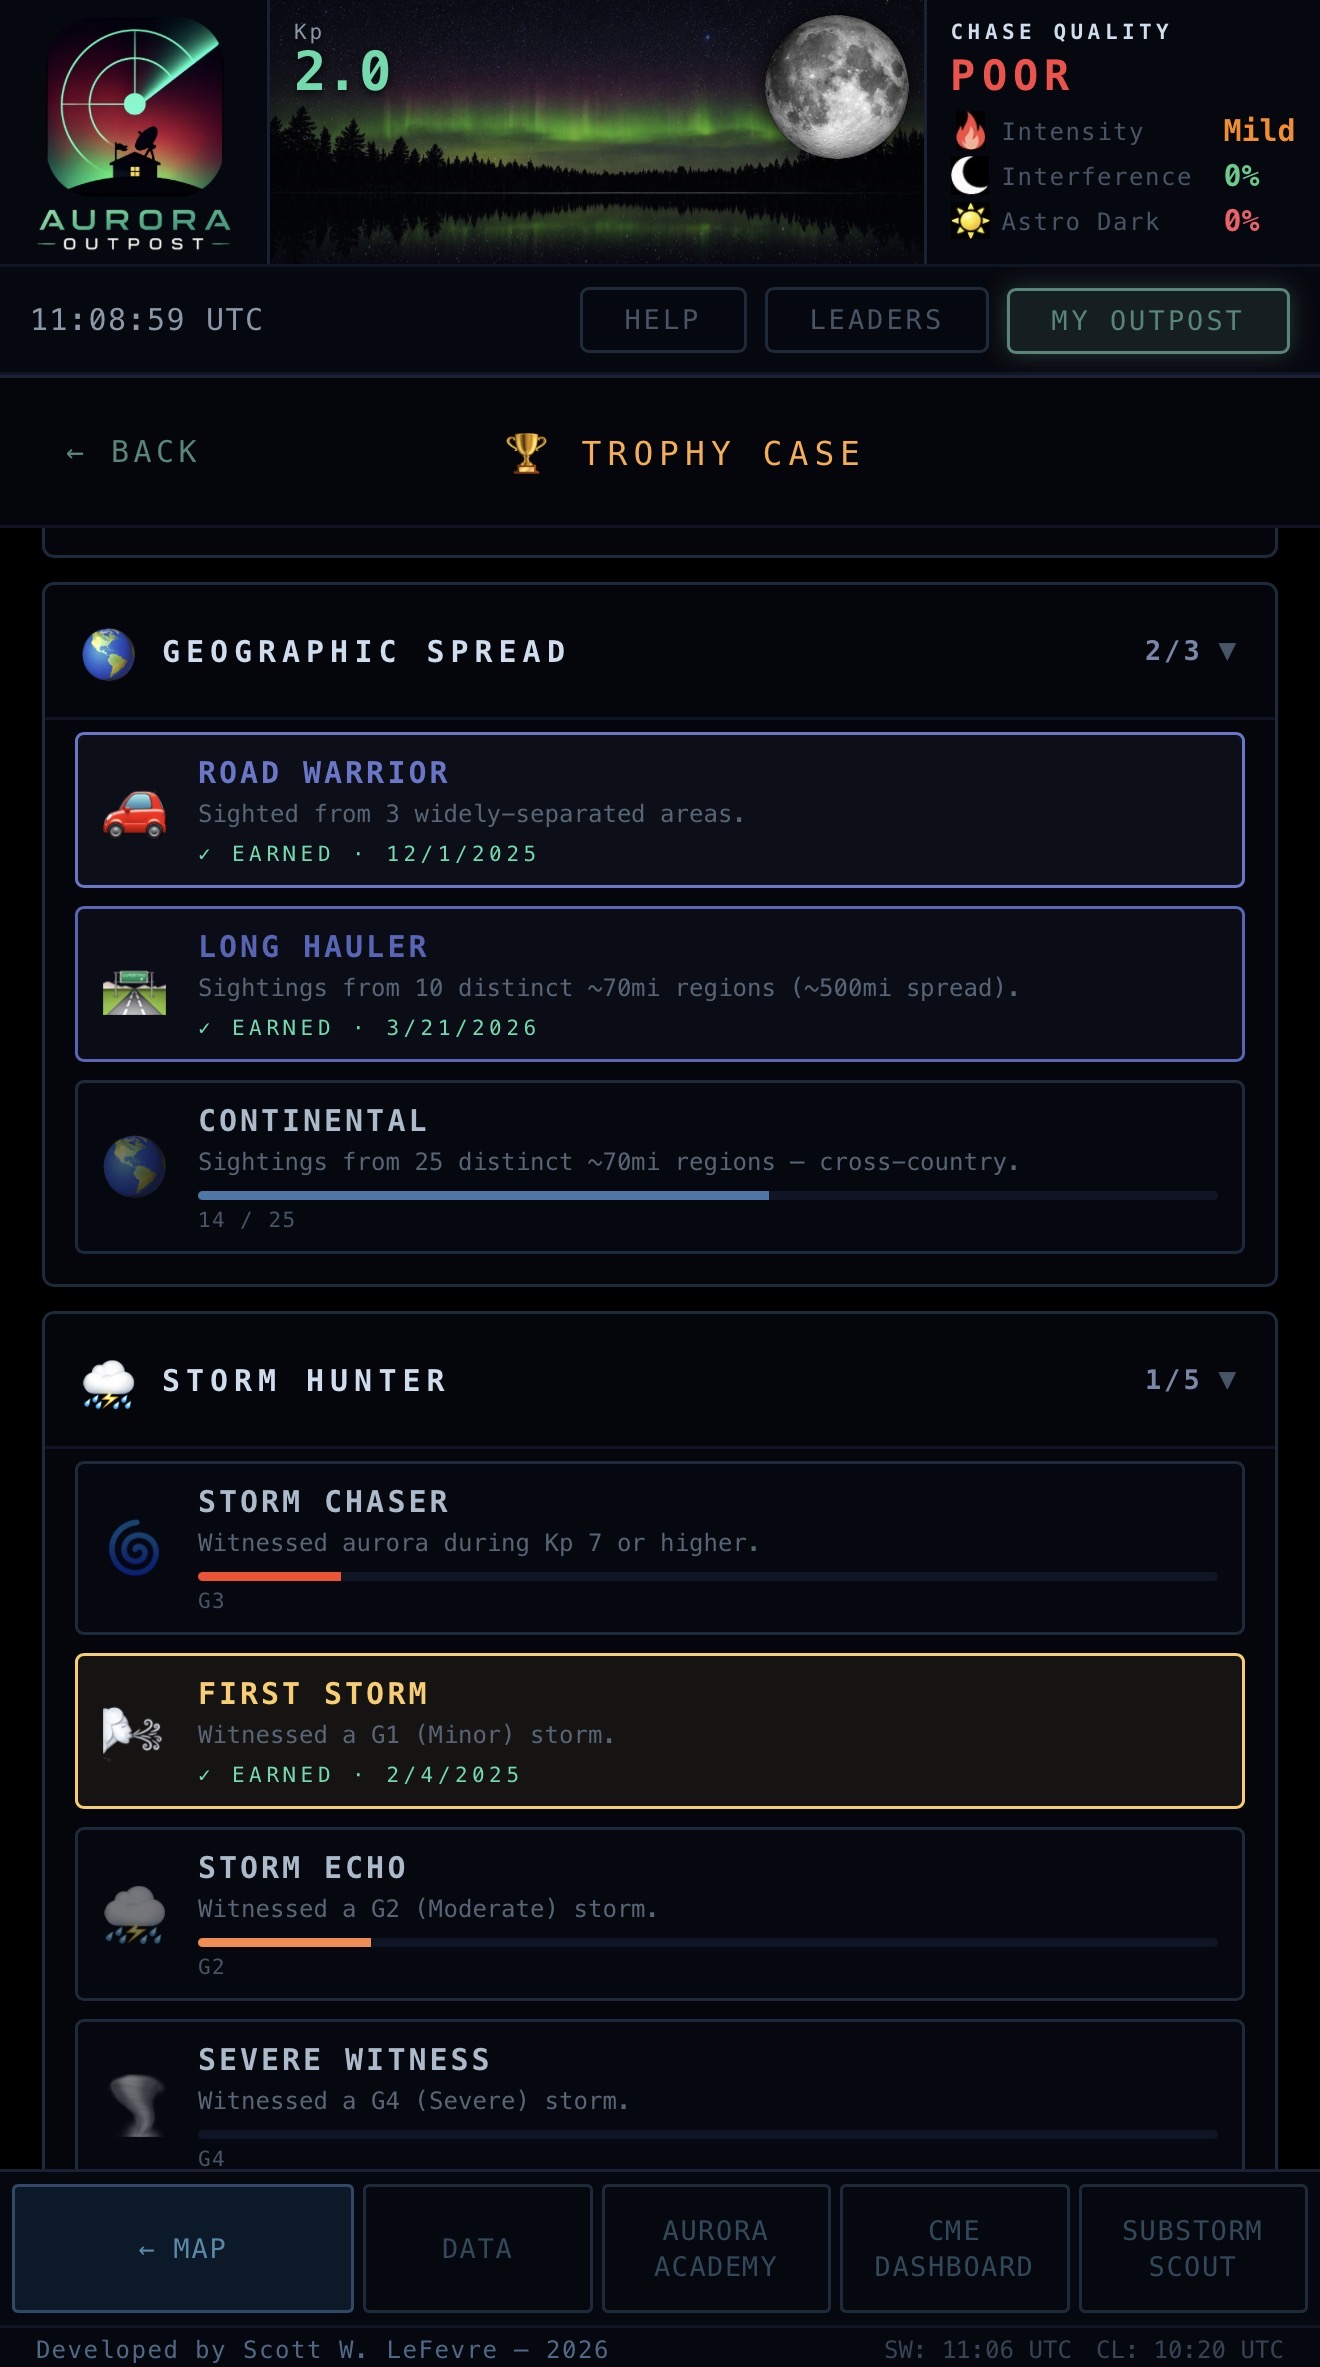
The Trophy Case is its own page under My Outpost. The top is the same outlined emoji-box that shows on your public profile — what other chasers see when they tap your name. Below it, every badge in the system is grouped into collapsible category dropdowns showing your live progress toward each one: e.g. “Spring Specialist · 3 / 10” with a progress bar, ticking up the moment you log a qualifying sighting. Earned badges are stamped with the date you got them and a teal “✓ EARNED” flag.
Pick any one earned badge to display next to your username — in your hero banner, in friend rows, on sighting cards, anywhere your handle shows up. Tap a badge in the case and a confirmation popup asks “display this badge?” before applying. Change it whenever you want, but only from badges you've actually earned. Tap any chip next to a username (yours or anyone else's) and a popup pops up showing the badge name and how to earn it — so anyone can see what a badge represents without leaving context. Settings has a one-tap HIDE button that clears your displayed chip without removing the badge from your case.
Empty trophy cases get a 🕷️ that crawls back-and-forth across the box — charming reminder that nothing's been earned yet, and a low-key push to log your first sighting.
Awarded automatically the moment you cross a threshold — no claim button, no waiting. Seven categories:
🌌 Sighting Volume — First Light (1) → Outpost Legend (1,000).
🔭 Site Variety — Local Spotter (5 spots) → Cartographer (100 spots).
🌎 Geographic Spread — Road Warrior (3 regions) → Continental (25 regions, ~1,500 mi spread).
⛈️ Storm Hunter — First Storm (G1) → Extreme Sighting (G5, the rarest).
🌙 Late Night — Night Owl (5 small-hours) → Vampire (100 small-hours).
✨ Special Conditions — Polar Pull (lat > 55°N), Tropic Witness (lat < 35°N, big-storm bragging rights), Equinox Warrior (Russell-McPherron window), Full Moon Defier (caught it through lunar washout), Cloud Threader (caught it through clouds).
🍃 Seasonal — Spring / Summer / Autumn / Winter Specialist (10 sightings in that season — a real seasonal commitment, not a one-good-week thing). Plus Four Seasons for catching at least one in every season.
Plus manual badges handed out by admins for one-off events — rare configurations, community contributions, or just being the chaser who showed up to the unusual show. The system protects badge integrity: sighting reports are tied to your actual GPS (or IP-based location when GPS is off), so you can't game Polar Pull from Florida. And admins can revoke any badge earned via spammed or fake reports — keeps the trophy case honest.

LEARNING
Interactive simulators that make the science click. Built around how chasers actually learn — not lecture-style. Each module is a touch-driven sandbox you can play with for two minutes and walk away with a real intuition.
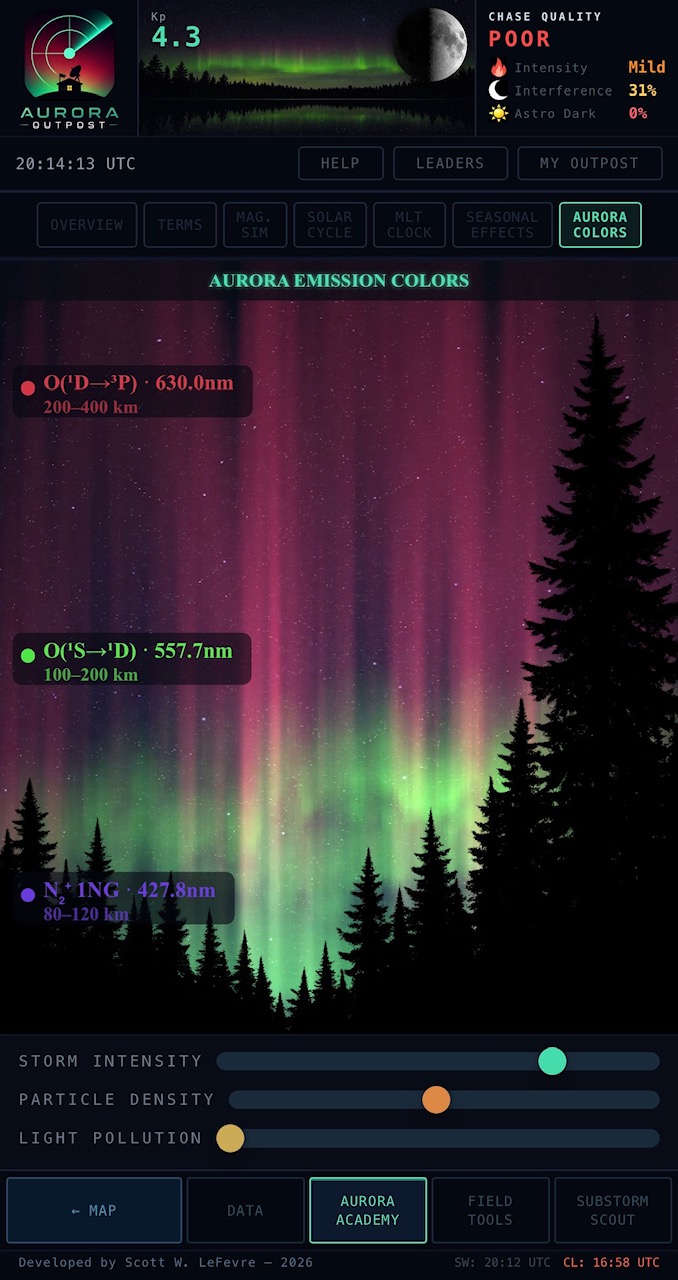
Aurora Colors (top) lets you drag sliders to see how storm intensity, particle density, and light pollution shape what your eyes vs your camera will actually see — finally answers "why did it look pink in the photos but green in real life?"
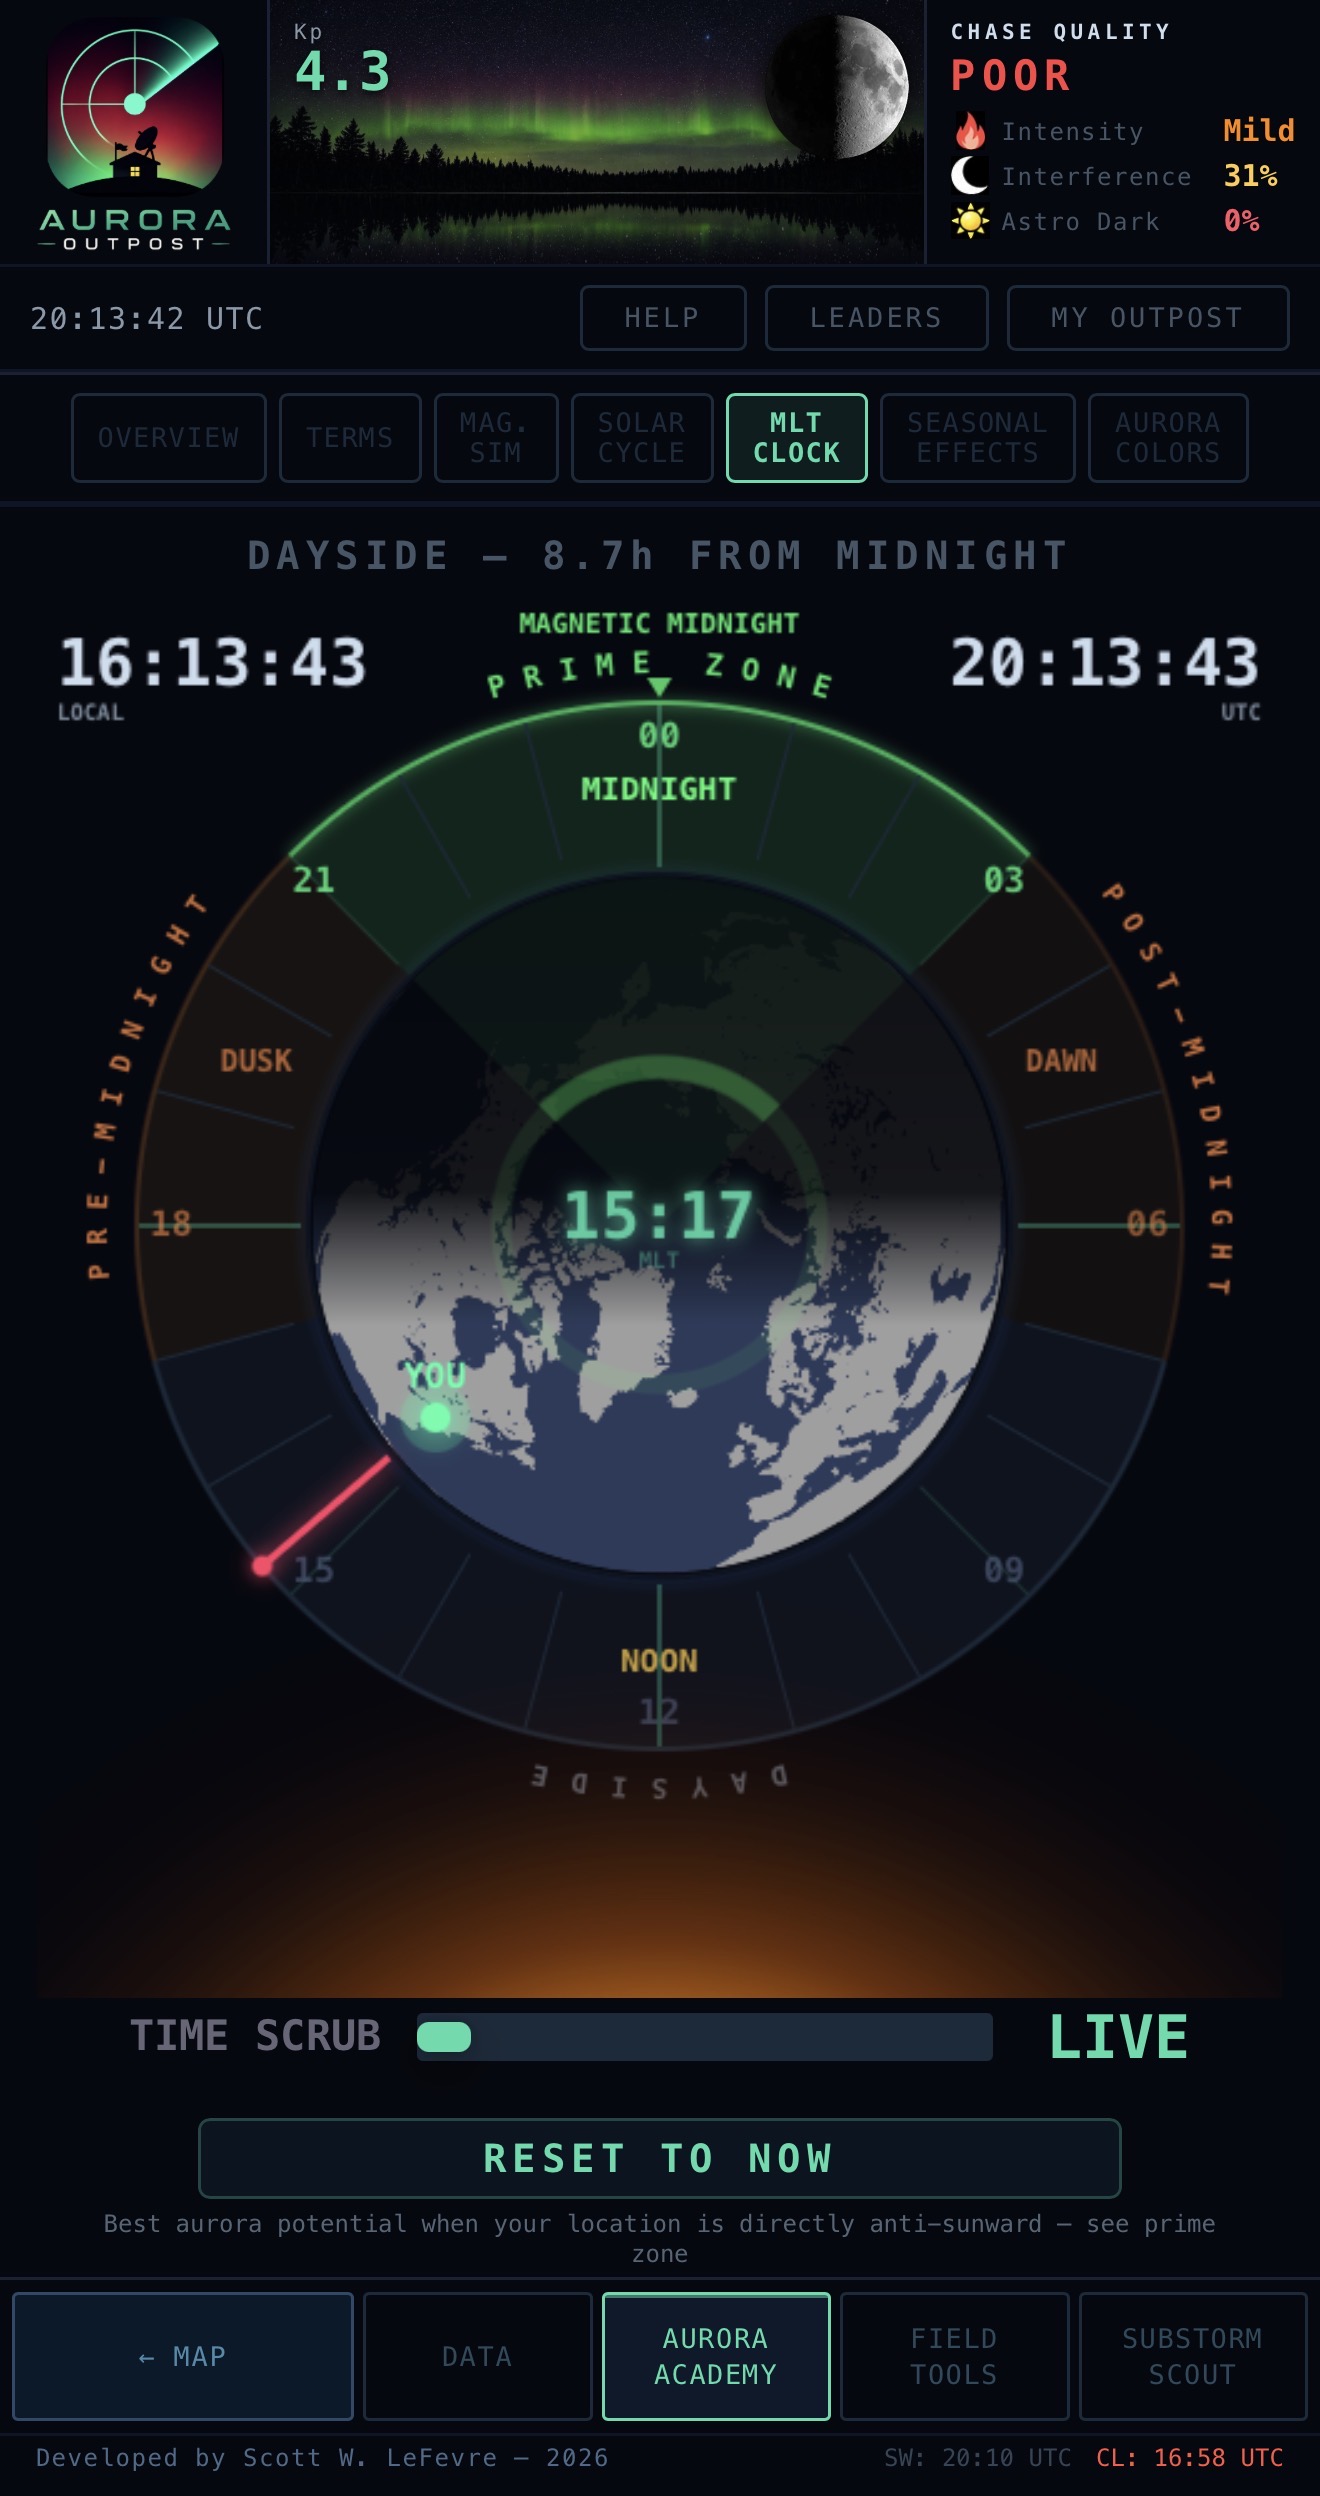
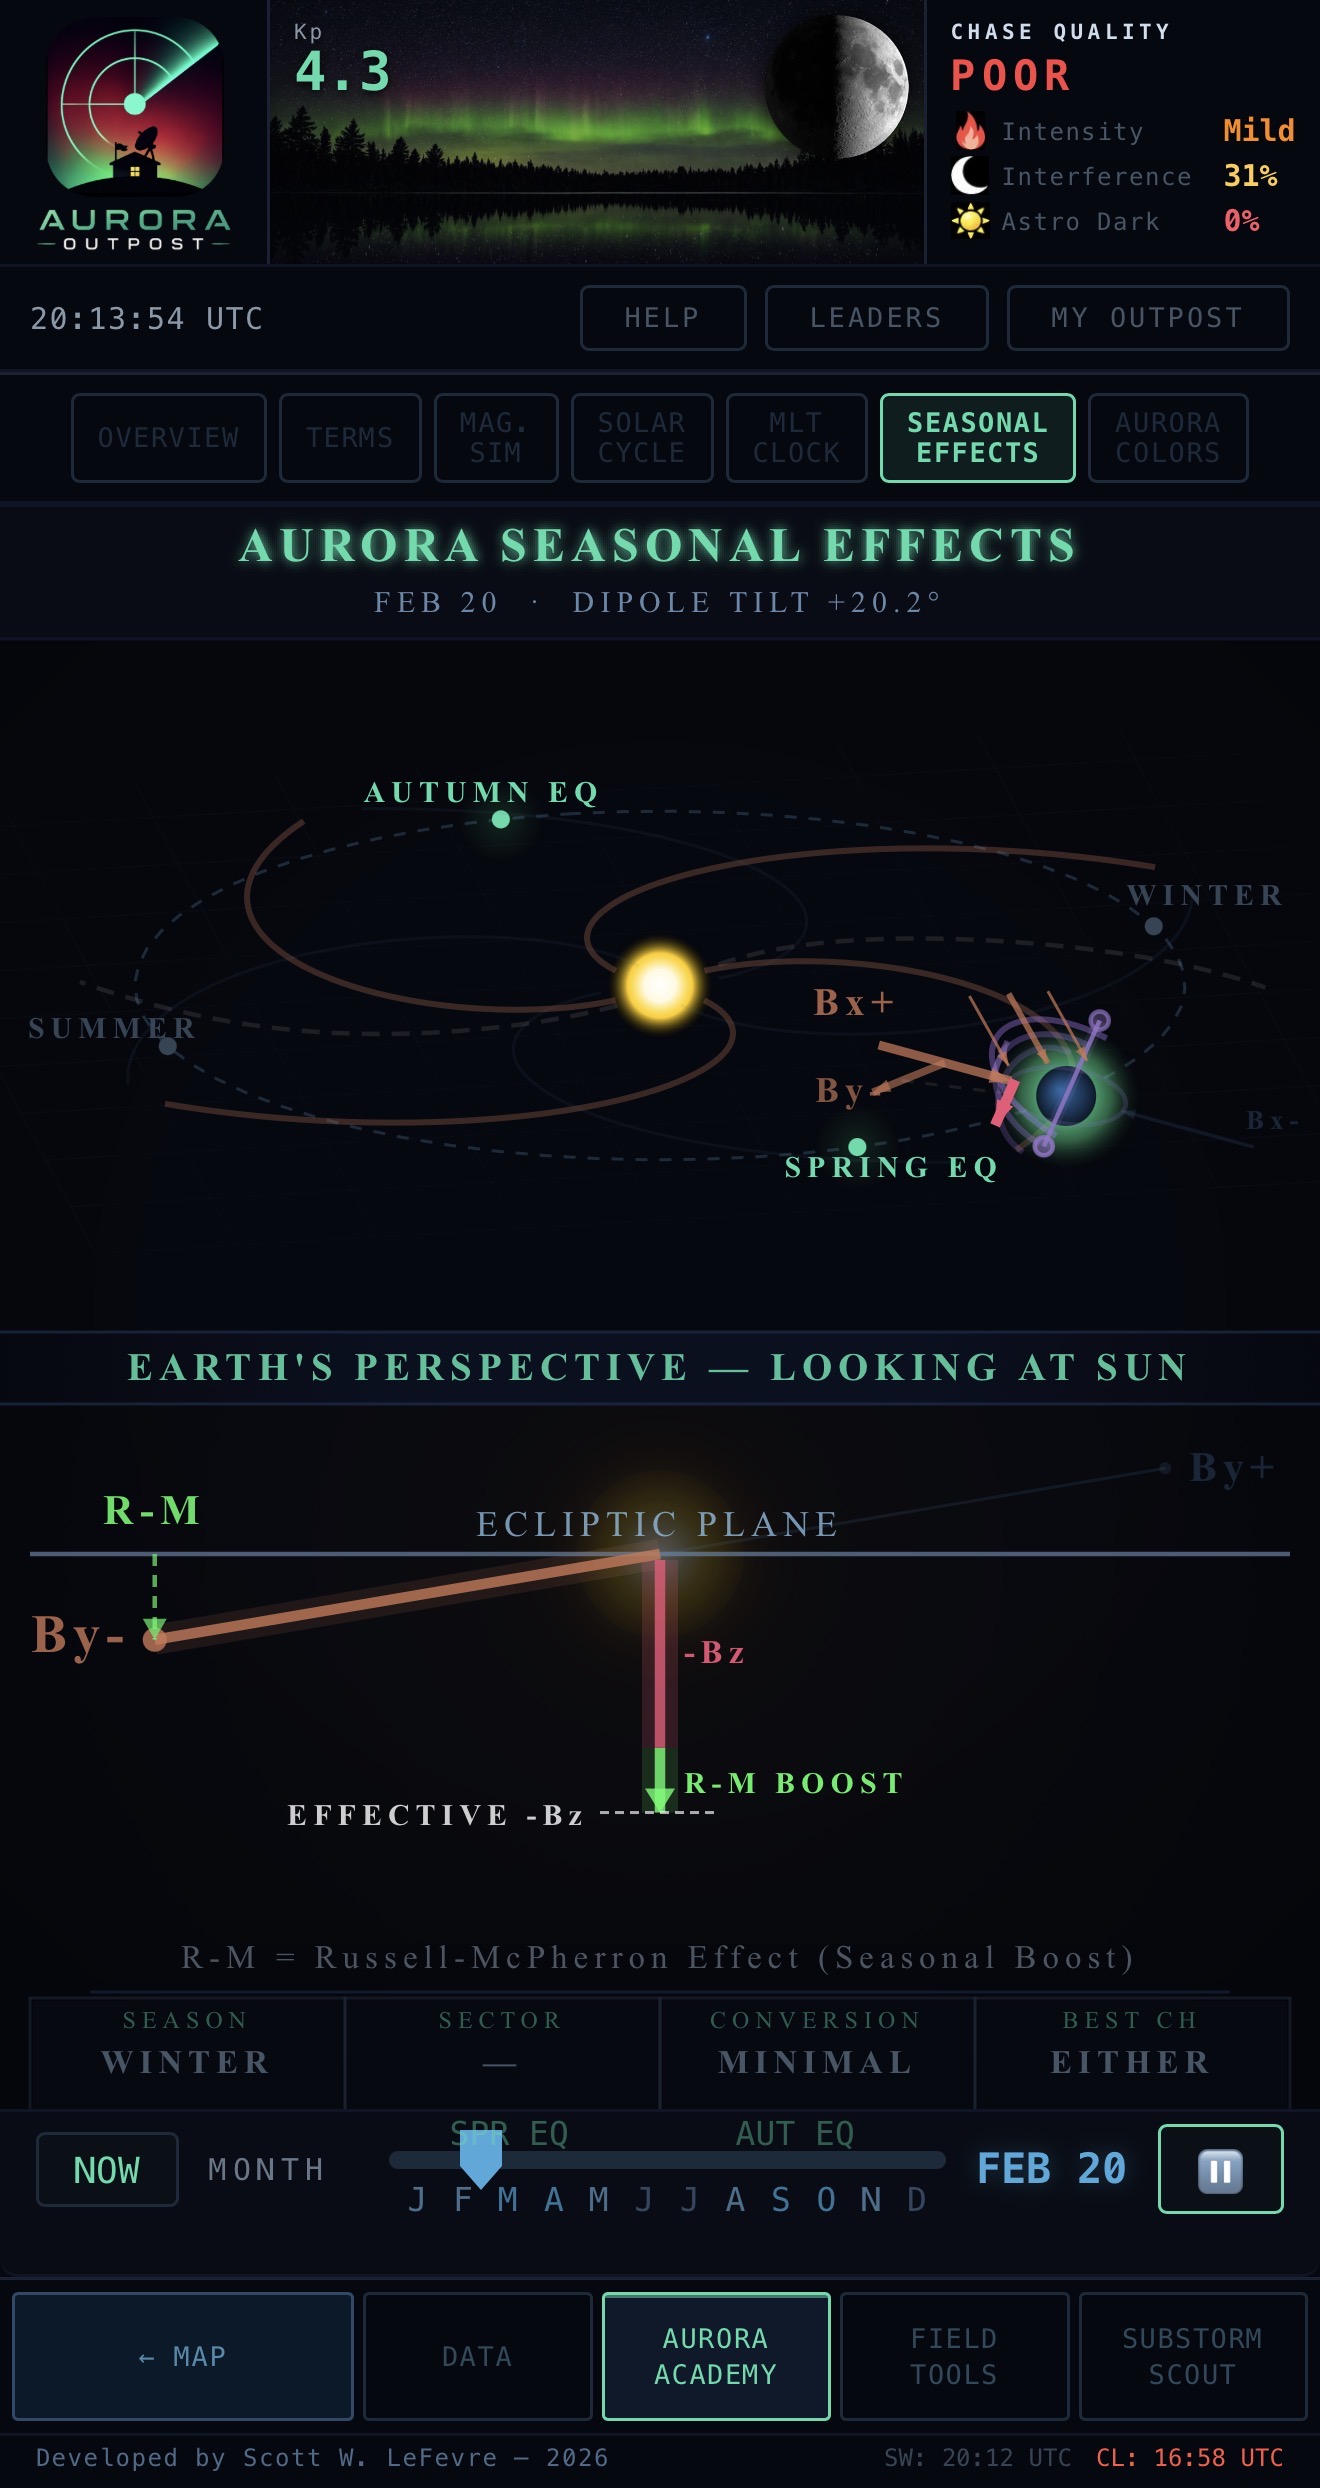
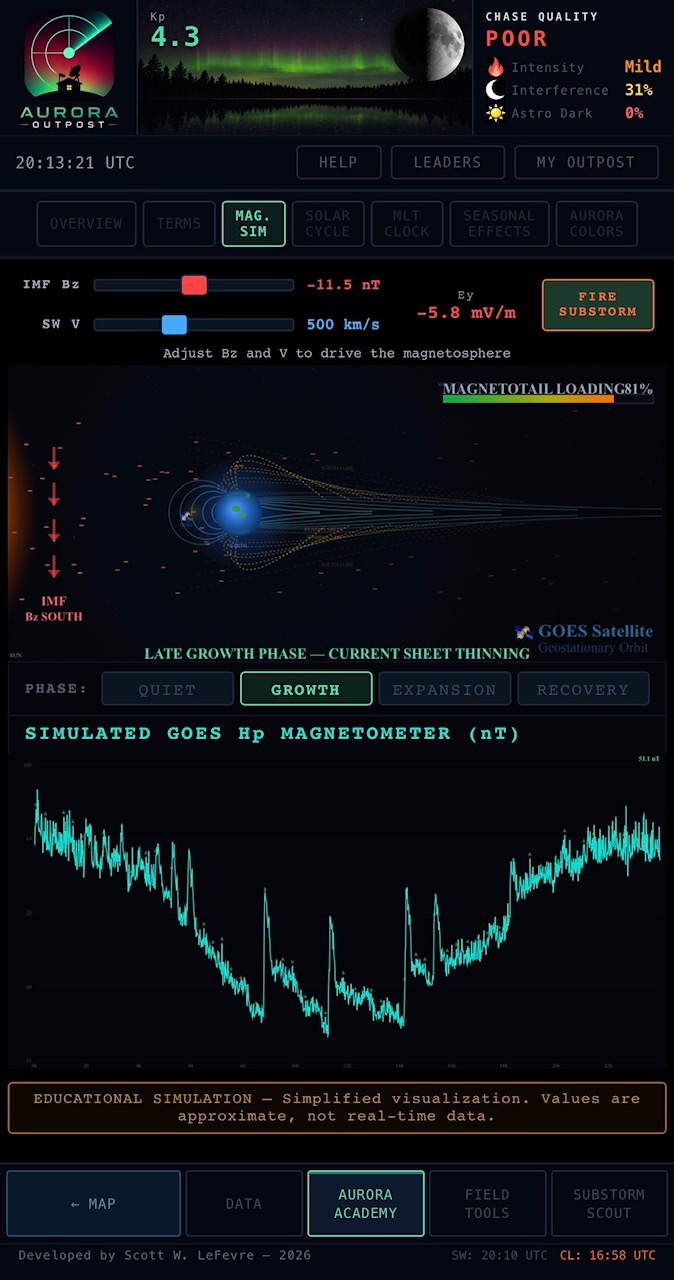
MLT Clock visualizes magnetic local time as Earth rotates so you see why magnetic midnight matters for substorms — and includes an estimated By-effect rotation that shows how the IMF’s east-west component shifts effective magnetic midnight, moving the optimal viewing window earlier or later. Solar Cycle shows where we are in the 11-year sunspot cycle and what to expect. Seasonal Effects explains the Russell-McPherron Effect (why aurora peaks at the equinoxes) without jargon, with a polarity slider you can drag through the year. Magnetosphere Sim shows the bow shock, magnetopause, magnetotail, and the dynamic boundary that produces aurora in the first place.
Hit the HELP button in the timeline, then tap any element on the screen to learn what it is. Every dashboard widget, map layer toggle, chase tool, and footer button is wired up. Turns the whole app into a self-guided explainer.
No manual to read, no docs to dig through, no tooltips to memorize. Point at what you don’t understand, and the app tells you what it is, what threshold matters for chasing, and where the data comes from.
Plain-language definitions of every space-weather term used anywhere in the app, written for chasers, not academics. Bz, By, Bx, Bt, Kp, Hp30/60, AE, AL, AU, SNAP, MLT, OVATION, IMF, HSS, CME, CIR, ICME, EPAM, sheath, flux rope, Bothmer-Schwenn, Russell-McPherron, substorm onset / expansion / recovery — if it shows up on the dashboard, it’s defined.
Search by term, browse by category, or land directly from any tap-help interaction.